Stock heatmaps are your secret weapon to spotting market trends instantly and winning big — without decoding complex charts.
These colorful, data-rich grids can show you more in 10 seconds than a spreadsheet might in 10 minutes.
If you’ve ever wished for a way to spot big opportunities fast, heatmaps are your new best friend.
But how do they work, and how can you actually use them to get ahead — not just scroll through them like digital wallpaper?
Let’s break it down.
Table of Contents
What Are Stock Heatmaps, Really?
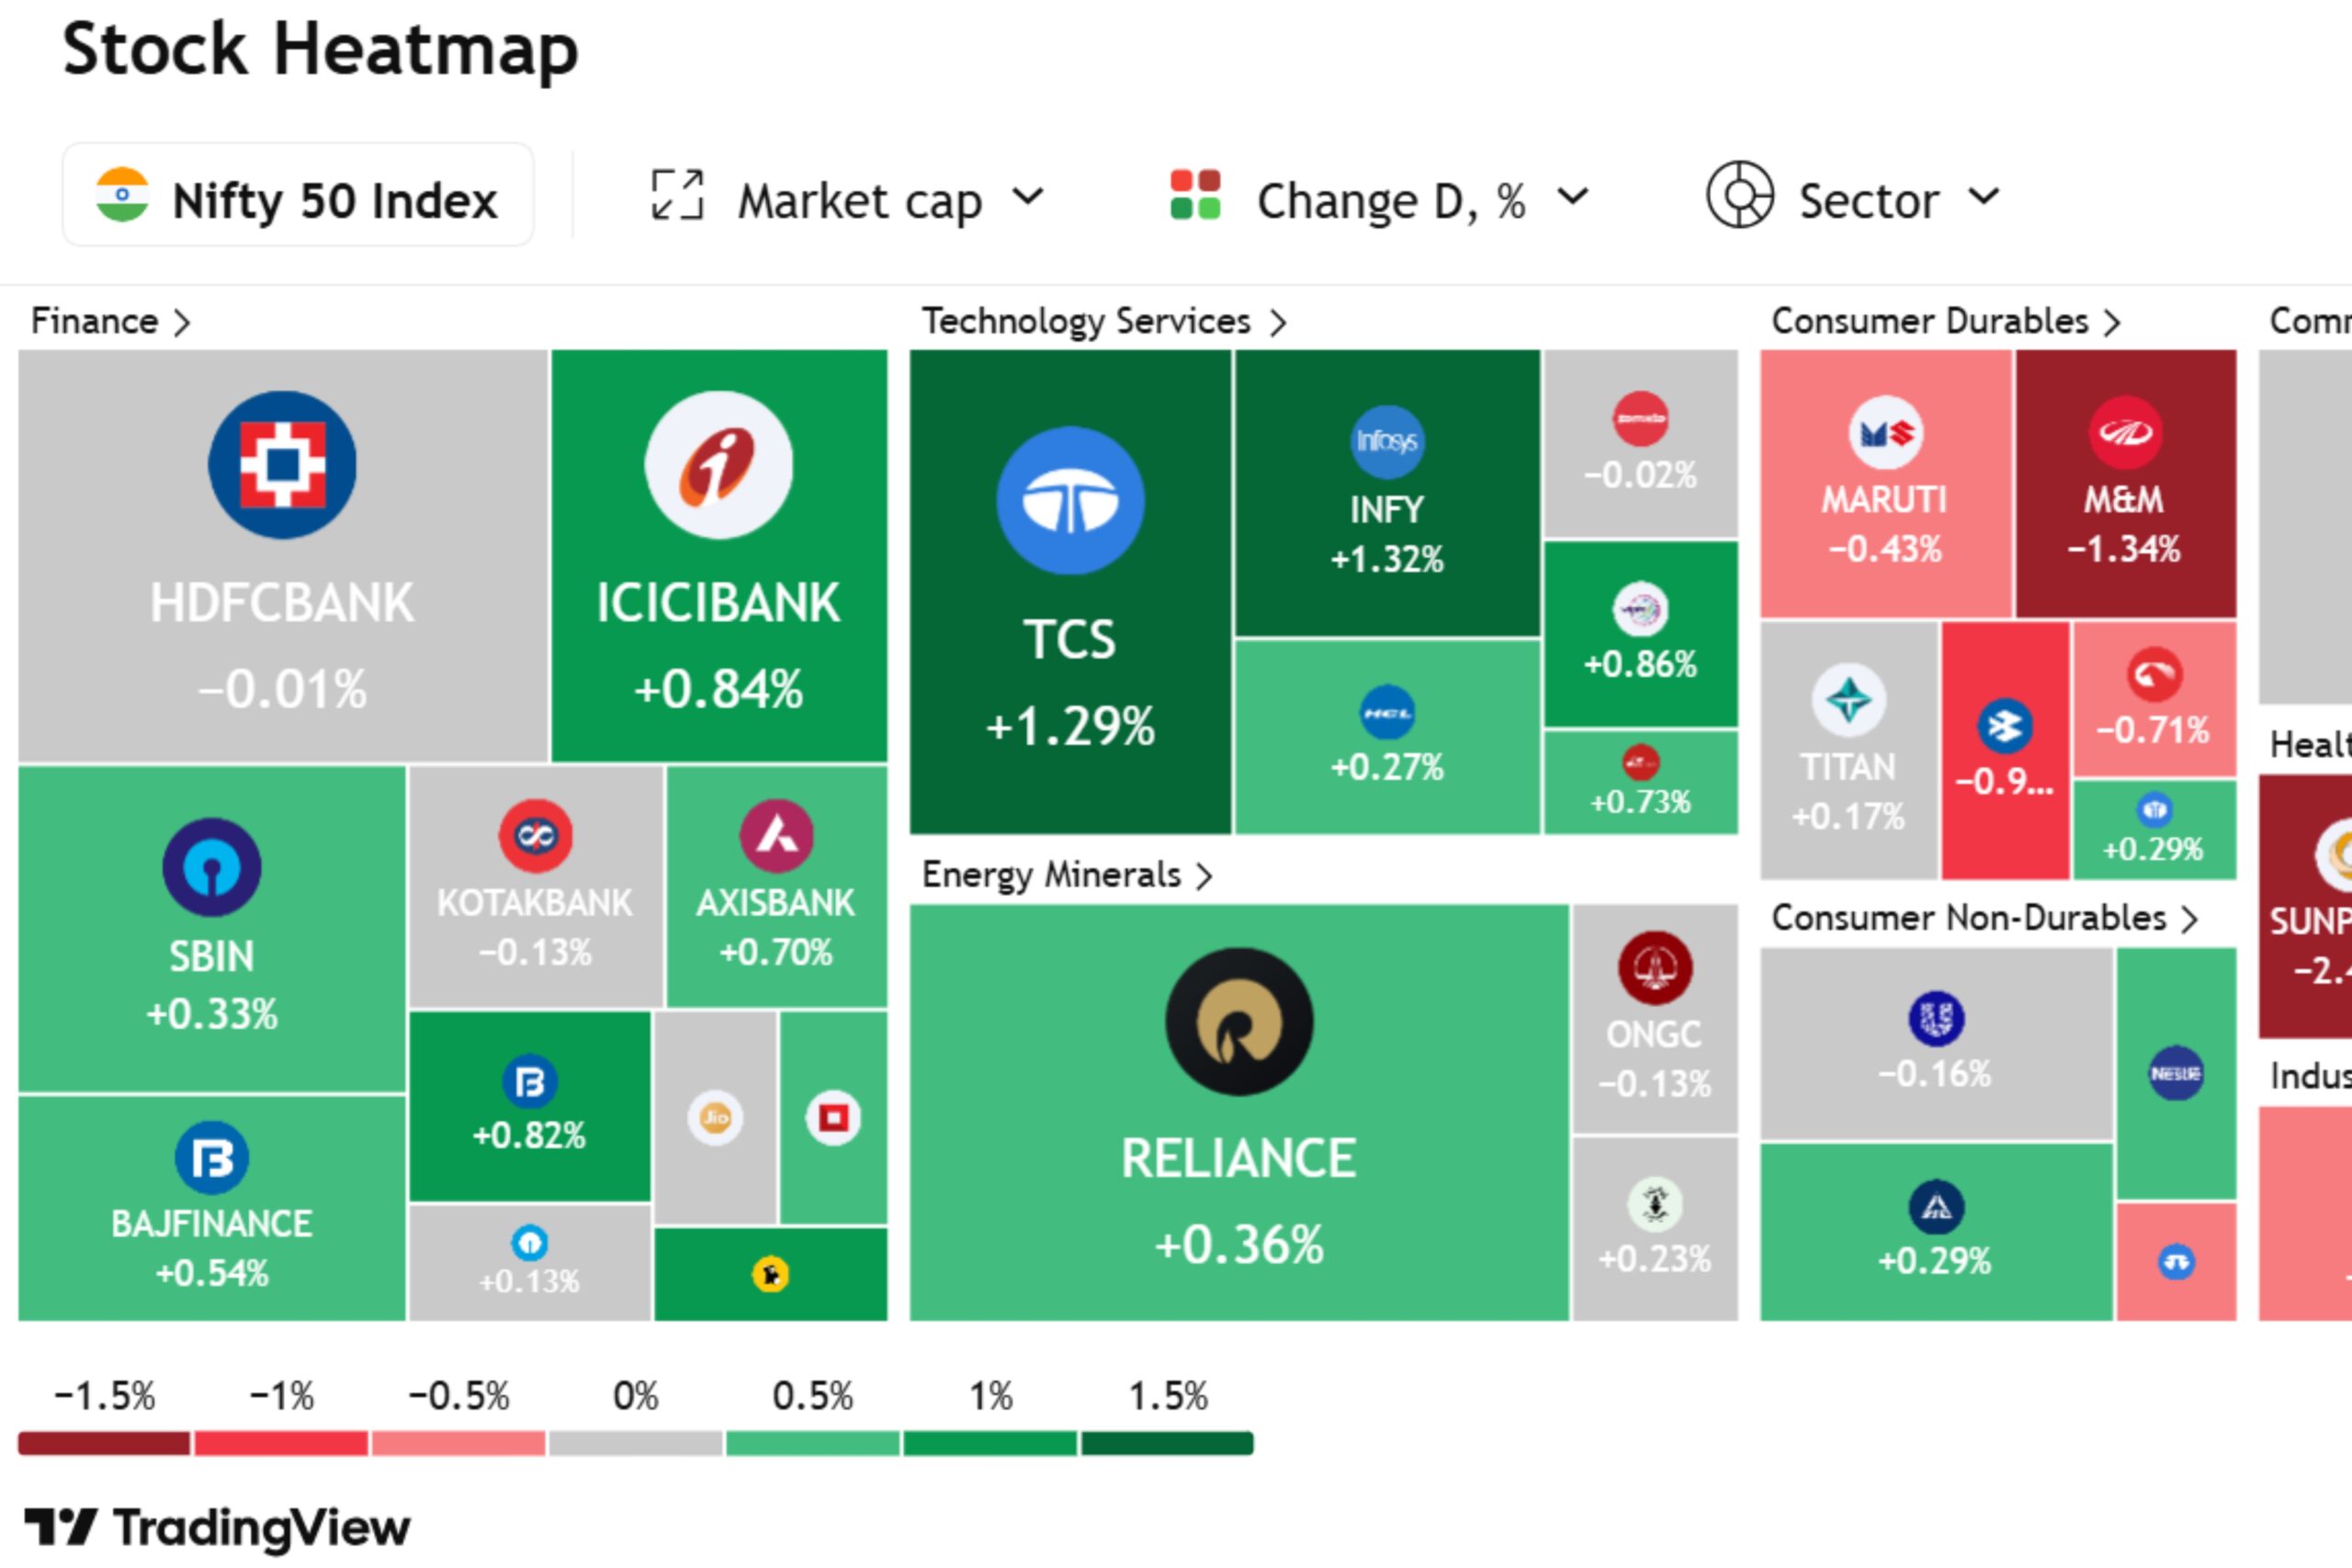
Imagine walking into a room where every stock on the market lights up based on performance — green for gainers, red for losers, and varied shades showing how strong or weak they are. That’s exactly what a stock heatmap does.
It’s a visual tool that helps you:
- Spot overall market sentiment quickly
- Identify outperforming and underperforming sectors
- Pick trending stocks in seconds
Most platforms like TradingView, Finviz, and Investing.com offer live heatmaps where stocks are grouped by industry, sector, or even country.
Why They’re So Powerful
Your brain processes visual data faster than text. Heatmaps take advantage of this by giving you real-time insight at a glance, especially when you’re feeling overwhelmed by too many tickers or charts.
Let’s say tech is exploding — a heatmap will show that entire sector glowing green, alerting you in real time that something big is happening.
Also Read: Support & Resistance
How to Read a Stock Heatmap Like a Pro
Start With the Colors
- Bright Green: Strong price gain
- Light Green: Mild price gain
- Gray/Neutral: No major change
- Light Red: Mild drop
- Dark Red: Significant loss
Don’t just look for green boxes. Look for clusters. If a whole sector like healthcare or energy is bright green, you’re seeing a sector-wide rally — not just one lucky stock.
Also Read: Color Trading
Next, Look at Size
In most heatmaps, box size = market cap. That means bigger companies show up as bigger boxes. For example, Apple might dominate the tech section simply because it’s massive — not necessarily because it moved the most that day.
This helps you weigh importance. A 2% drop in a giant stock like Microsoft can shake the whole sector more than a 10% drop in a tiny one.
Also Read: Technical Analysis
Then, Explore Filters
Most platforms let you filter by:
- Time frame (1-day, 1-week, YTD)
- Market cap (large-cap, small-cap)
- Sector or industry
- Country or exchange
Use these filters to narrow your focus and spot patterns faster.
Also Read: What are ETFs
Best Ways to Use Stock Heatmaps in Real Life
1. Spot the Market Mood Instantly
Also Read: How to Open a New Trading Account
2. Find Hot Sectors Before Everyone Else
If energy stocks are consistently green while the rest of the market struggles, there’s a story there.
Maybe oil prices are rising. Maybe a new regulation is favoring green energy.
Heatmaps can help you catch early market trends and explore them further.
Also Read: Options Trading
3. Identify Momentum Stocks
4. Catch Reversals and Oversold Opportunities
Also Read: Hedging
Are Heatmaps Useful in Bear Markets?
Absolutely — and even more so. In bear markets, many traders either freeze or lose clear direction. Heatmaps filter out the noise, highlighting both weak and unexpectedly steady sectors.
Amid widespread losses, areas like healthcare or utilities can quietly hold their ground. That’s smart insight — great for dodging losses and uncovering overlooked long-term plays.
During downturns, heatmaps act like radar — guiding you through the chaos with confidence.
Also Read: Nifty Expiry
Where to Find the Best Stock Heatmaps
Here are some platforms worth exploring:
| Platform | Best For | Free or Paid |
|---|---|---|
| Finviz | U.S. stocks, sector-based views | Free & Paid |
| TradingView | Global markets, customizable layers | Mostly Paid |
| Investing.com | Simple layout, news integration | Free |
| Yahoo Finance | Quick look, casual users | Free |
You don’t need to use all of them. Just pick one or two that match your trading style.
Also Read: Fundamental Analysis
Common Mistakes to Avoid
Even though heatmaps are super helpful, they’re not foolproof. Here’s what not to do:
- Don’t chase green blindly: Just because a stock is up doesn’t mean it’s a smart buy.
- Don’t ignore volume: Check if moves are backed by strong trading activity.
- Do not use heatmaps alone: Combine them with other tools — RSI, moving averages, news, etc.
Think of heatmaps like weather radars — they show where the storm is, but not how strong it’ll be or where exactly it’s headed.
Also Read: Trading Mistakes to Avoid
Practical Heatmap Workflow for Daily Trading
Here’s a simple way to use heatmaps in your daily prep:
Morning Routine:
- Open your favorite heatmap tool
- Scan for biggest green/red clusters
- Click on individual sectors for detail
During the Day:
- Re-check every 2–3 hours for sector rotation
- Add 2–3 trending stocks to your watchlist
- Avoid noise — focus only on patterns, not random flashes
End of Day:
- Review top movers and see if trends sustained
- Use insights to prep your trades for tomorrow
By repeating this process, you build market awareness — not just stock picks.
Also Read: Gift Nifty
FAQs: Using Stock Heatmaps
Are stock heatmaps only for day traders?
Not at all. Swing traders and even long-term investors use heatmaps to spot trends and time entries better.
Can I use heatmaps on my phone?
Yes! Most platforms like Finviz and TradingView are mobile-friendly or have apps.
Do heatmaps work for global stocks?
Definitely. Just make sure you select a platform that covers international markets — like TradingView or Investing.com.
What’s better — heatmaps or candlestick charts?
They serve different purposes. Use heatmaps for trend scanning, and candlestick charts for entry/exit timing.
Can beginners use heatmaps?
Also Read: Trading Victory
Takeaway: Heatmaps Make Winning Simpler
If you’re tired of staring at endless charts and numbers, stock heatmaps offer a visual shortcut to smarter decisions.
They don’t predict the future — but they do reveal powerful trends you might otherwise miss.
Start using them daily, trust what you see, and let patterns guide your strategy.
👉 Your next smart move? Pick your favorite platform, open the heatmap, and just explore. You’ll be surprised at what you start noticing.
Also Read: Trading Account Setup