A strategy loses six out of every ten trades. At first glance, that sounds like a poor strategy.
But win rate tells you only how often a strategy wins. It does not tell you how much it makes when it wins or loses when it fails.
Yes, a strategy with a 40% win rate can be profitable if its average winning trade is sufficiently larger than its average losing trade and the advantage remains positive after trading costs. With a 40% win rate, the average winner must be more than 1.5 times the average loser to have positive expectancy before costs.
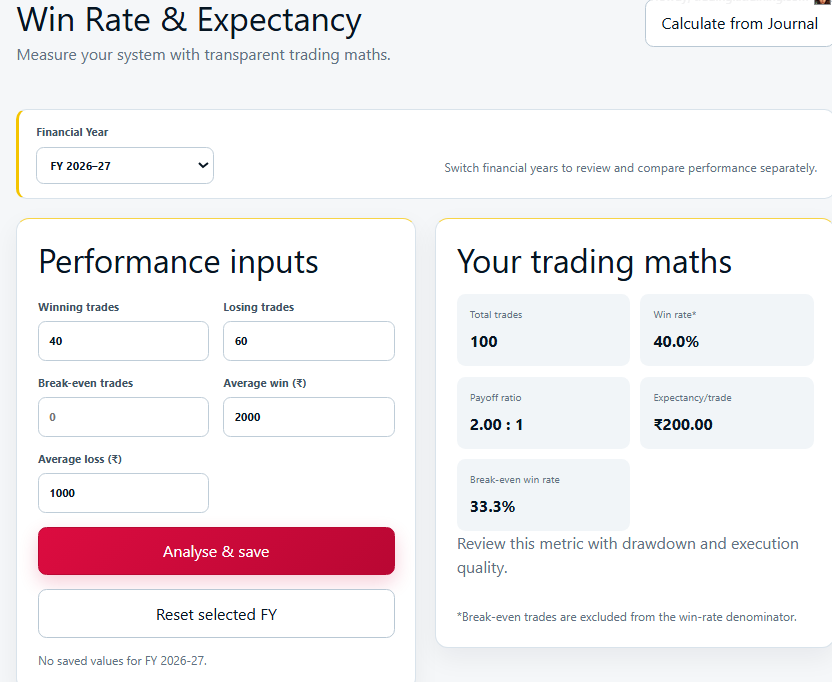
For example, if the average winner is ₹2,000 and the average loser is ₹1,000, a 40% win-rate strategy has gross expectancy of ₹200 per trade. That does not mean every trade will earn ₹200. It is a long-run average derived from the selected sample.
Table of Contents
Author Observation: When I was still getting comfortable with trading, I used to judge a strategy by how often it won. A few losing trades would bother me more than they probably should have, especially when I had several wins before them. I remember looking back at one stretch of trades and thinking the setup had stopped working, even though the winners were noticeably larger than the losses. At the time, I was paying more attention to the number of green and red trades than what each trade was actually adding or taking away.
Can a 40% Win-Rate Strategy Make Money?
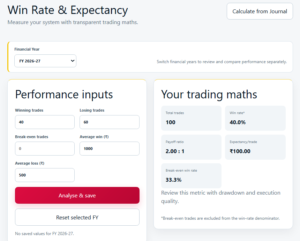
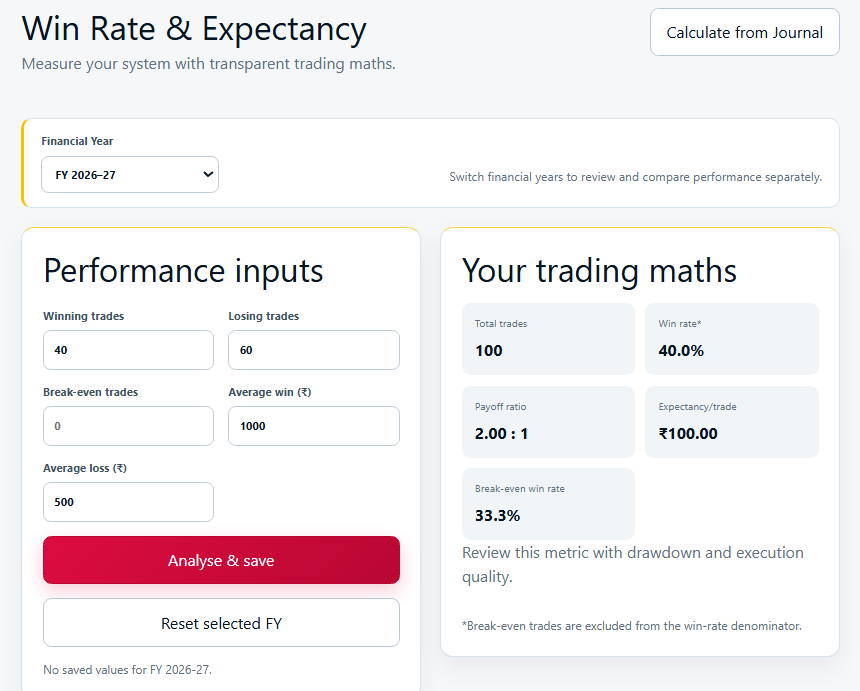
A 40% win-rate strategy can have positive expectancy when its average winner exceeds 1.5 times its average loser before costs. At a 40% win rate, 40 winning trades must compensate for 60 losing trades over a hypothetical 100-trade sample.
- Win rate: 40%
- Loss rate: 60%
- Average win: ₹2,000
- Average loss: ₹1,000
What Is Trading Expectancy?
Trading expectancy estimates the average amount a strategy made or lost per trade across a defined historical sample. It combines win rate, average winning result and average losing result. Positive historical expectancy means the analysed sample was profitable on average; it does not guarantee future profits.
Expectancy answers: Based on the trades being analysed, what was the average result of one trade?
- It does not predict the next trade.
- It does not reveal maximum drawdown.
- It does not prove the edge will continue.
- It does not show whether the sample is representative.
- It does not guarantee consistent execution.
Trading Expectancy Formula
Use the average loss as a positive magnitude. Convert percentages to decimals: 40% = 0.40 and 60% = 0.60. Use either gross outcomes throughout or net outcomes throughout.
How is win rate calculated?
How is average win calculated?
How is average loss calculated?
Worked Example: 40% Win Rate and ₹2,000 Average Win
- Total trades: 100
- Winning trades: 40
- Losing trades: 60
- Average winner: ₹2,000
- Average loser: ₹1,000
| Input | Value |
|---|---|
| Total trades | 100 |
| Winning trades | 40 |
| Losing trades | 60 |
| Win rate | 40% |
| Average win | ₹2,000 |
| Average loss | ₹1,000 |
| Gross expectancy | ₹200 per trade |
| Gross sample result | ₹20,000 |
This does not mean the account will earn ₹200 after every trade. Results arrive in an uneven sequence.
What Reward-to-Risk Ratio Is Required at a 40% Win Rate?
A 40% win-rate strategy needs an average winner greater than 1.5 times its average loser to have positive expectancy before costs. At exactly 1.5 times the average loss, gross expectancy is zero.
| Average win | Average loss | Gross expectancy |
|---|---|---|
| ₹1,200 | ₹1,000 | −₹120 |
| ₹1,500 | ₹1,000 | ₹0 |
| ₹2,000 | ₹1,000 | ₹200 |
| ₹2,500 | ₹1,000 | ₹400 |
| ₹3,000 | ₹1,000 | ₹600 |
Why Can a High Win-Rate Strategy Still Lose Money?
A high win rate does not guarantee profitability because a few large losses can outweigh many small winners. Profitability depends on both frequency and magnitude after costs.
| Metric | 40% strategy | 70% strategy |
|---|---|---|
| Win rate | 40% | 70% |
| Average win | ₹2,000 | ₹400 |
| Average loss | ₹1,000 | ₹1,200 |
| Gross expectancy | ₹200 | −₹80 |
| Sample outcome | Positive | Negative |
Gross Expectancy Versus Net Expectancy
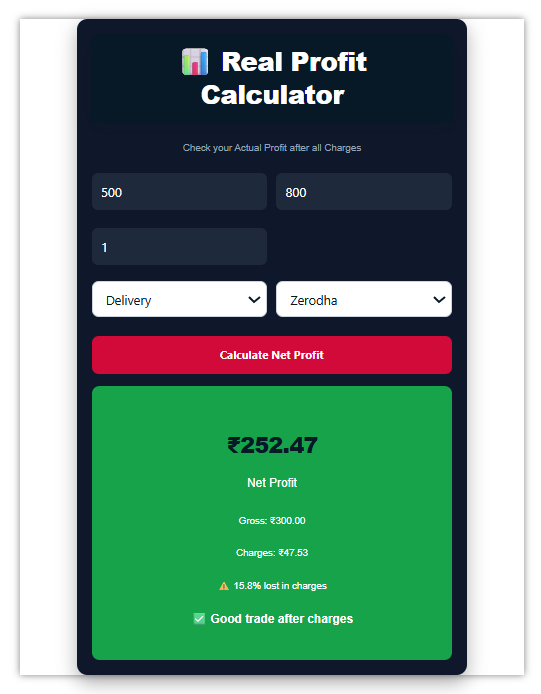
Gross expectancy excludes trading costs, while net expectancy uses results after brokerage, taxes, exchange charges, slippage and other applicable costs. Net expectancy is the more relevant measure of the amount retained by the trader.
- Brokerage
- Securities Transaction Tax
- Exchange transaction charges
- GST
- SEBI charges
- Stamp duty
- Bid-ask spread
- Slippage
NSE states that, from 1 April 2026, STT on the sale of securities futures is 0.05%, while applicable options-premium and exercised-option categories are subject to 0.15%. Verify current rates for the relevant transaction type before publication.
How Do Costs Change the Break-Even Requirement?
Before the assumed costs, the break-even average winner was ₹1,500. With the assumed ₹100 average cost, it becomes ₹1,750. A small gross edge can therefore disappear after costs.
SEBI’s FY25 equity-derivatives analysis reported results after transaction costs and found that approximately 91% of analysed individual traders incurred net losses during FY25. This population statistic does not predict the outcome of a particular trader or strategy.
What Is Expectancy in R-Multiples?
Expectancy in R-multiples expresses the average result per trade relative to the amount initially risked. If 1R represents initial planned loss, +0.20R means the sample produced an average result equal to 0.20 times initial risk per trade.
Use realised R rather than only the planned target. A planned 2R target is not an average realised winner of 2R unless execution data supports it.
How Is Break-Even Win Rate Calculated?
Break-even win rate is the win rate at which gross expectancy equals zero for a given average win and average loss. Before costs, it equals average loss divided by the sum of average win and average loss.
Costs increase the effective break-even requirement.
How to Calculate Expectancy From a Trading Journal
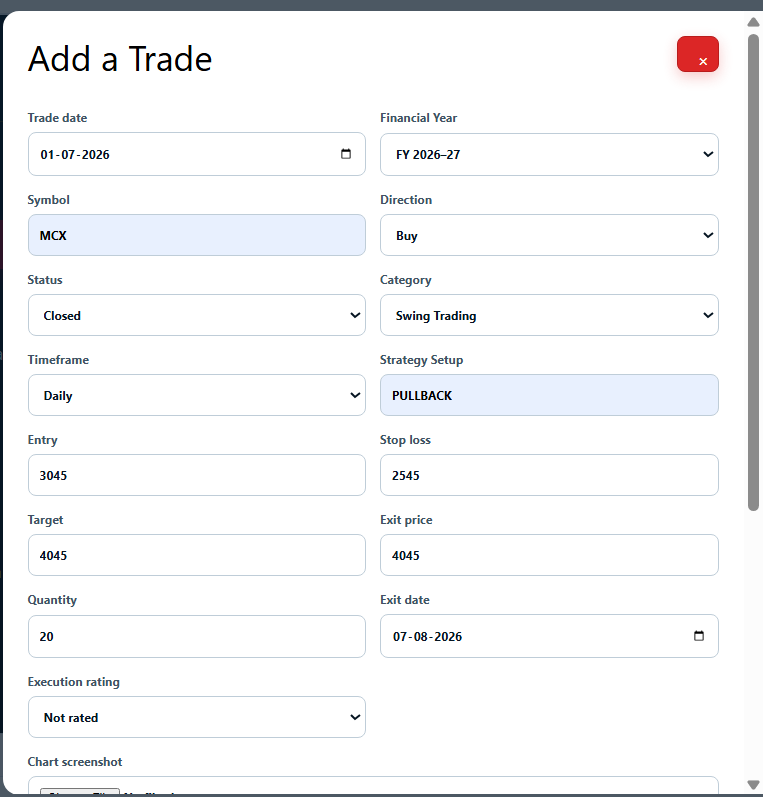
Use closed trades from one clearly defined strategy. Record:
- Trade date and market segment
- Setup name
- Entry and exit prices
- Position quantity
- Initial stop-loss
- Planned rupee risk
- Gross P&L
- Brokerage and statutory charges
- Slippage
- Net P&L
- Realised R-multiple
- Market condition
- Whether rules were followed
Step 1: Define the sample
Step 2: Separate outcomes
Identify profitable, losing and zero or near-zero trades.
Step 3: Calculate net outcomes
Subtract included costs consistently.
Step 4: Calculate averages
Step 5: Calculate expectancy
Step 6: Segment carefully
How Should Scratch Trades Be Treated?
Scratch trades should remain in the total sample because they consumed an opportunity and may still have incurred costs. A trade with no gross price movement can become a small net loser after costs.
This direct-average method naturally includes winners, losers, scratch trades and costs. If using the probability formula, disclose how scratch trades were classified.
How Many Trades Are Needed to Calculate Expectancy?
There is no universal number of trades that guarantees a reliable expectancy estimate. A small sample can be dominated by one outlier, while a larger sample can still mislead if conditions or rules changed.
- Use one clearly defined strategy.
- Apply consistent rules.
- Include all qualifying trades.
- Calculate rolling expectancy.
- Compare market regimes.
- Test outlier sensitivity.
- Separate backtested, paper and live results.
- Continue updating the estimate.
When Can Trading Expectancy Mislead You?
The sample is too small
One unusual result may dominate the average.
Strategy rules changed
The sample no longer represents one process.
Market conditions changed
A setup may behave differently across regimes.
Costs are omitted
Gross profitability may disappear after expenses.
Valid losses are excluded
Removing losses artificially improves results.
Backtest assumptions are unrealistic
The calculation may ignore slippage, liquidity or unavailable prices.
One outlier dominates
A single exceptional winner may create a misleading average.
Observations are correlated
Trades from one event may not be independent evidence.
Expectancy summarises a historical or hypothetical sample. It does not predict the next trade, maximum drawdown or whether the same edge will continue under future market conditions.
What Does Positive Expectancy Not Tell You?
- It does not predict the next trade.
- It does not describe the order of results.
- It does not show the largest possible loss.
- It does not guarantee the edge will continue.
- It does not determine position size.
- It does not prove rule compliance.
- It can hide unstable periods or segments.
Common Trading-Expectancy Mistakes
Looking only at win rate
Win rate without average win and average loss is incomplete.
Using target profit instead of realised profit
A planned 2R target is not a realised 2R average.
Ignoring costs
A small gross edge may become negative.
Removing valid losses
This artificially improves expectancy.
Mixing unrelated strategies
One setup can hide another setup’s weakness.
Using inconsistent loss signs
Enter average loss as a positive magnitude and subtract it once.
Treating expectancy as guaranteed income
It is a sample estimate, not a fixed payment.
Ignoring outliers
One result may dominate the average.
Changing rules during the sample
The result may no longer describe one strategy.
Trading-Expectancy Checklist
- ☐ All trades belong to one defined strategy.
- ☐ Winners, losers and scratch trades are included.
- ☐ Results use net P&L after costs.
- ☐ Win rate comes from the same sample.
- ☐ Average win and loss use realised outcomes.
- ☐ R-multiples use initial planned risk.
- ☐ Outlier sensitivity was checked.
- ☐ Market regimes were compared.
- ☐ Backtested and live trades are separate.
- ☐ Rules remained consistent.
- ☐ Expectancy is not presented as guaranteed income.
Methodology and Limitations
The guide uses hypothetical results and does not represent a real backtest, live record or recommendation. The main example assumes 100 trades, 40 winners, 60 losses, ₹2,000 average gross win, ₹1,000 average gross loss and an assumed ₹100 average cost only in the cost-adjusted example.
- Win rate and average outcomes may change.
- Costs differ by broker and instrument.
- Slippage is not constant.
- Outcomes may be correlated.
- Market regimes change.
- Averages can conceal extreme losses.
- Expectancy does not reveal maximum drawdown.
- Historical results do not guarantee future performance.
Key Takeaways
- A 40% win-rate strategy can be profitable.
- Its average winner must exceed 1.5 times its average loser before costs.
- A 70% win-rate strategy can still lose money.
- Expectancy combines win rate, average win and average loss.
- Net expectancy should include costs.
- R-multiples help compare different position sizes.
- Use realised outcomes—not planned targets.
- Include scratch trades consistently.
- Analyse one defined strategy.
- Positive historical expectancy does not guarantee future profitability.
Final Note
Win rate is emotionally attractive because frequent winning feels like proof that a strategy works. Expectancy asks whether the winners are large enough to outweigh the losers and costs.
The purpose is not to find a comforting number. It is to understand what produced the result and whether it remains stable after costs, outliers and changing conditions.
Author Observation: I’ve had periods where my trade log looked worse than the actual results felt. There might be a string of losing trades sitting next to a couple of decent winners, and my first reaction was usually to question the setup. Once, while reviewing an older batch of trades, I noticed I had been mentally treating every trade almost equally, even though the amounts won and lost were quite different. That changed how I looked at my journal. I started paying more attention to the money attached to each trade, not just whether I had marked it as a win or loss.
Educational Disclaimer
This article is for educational purposes only and does not constitute investment advice, a trading recommendation or a guarantee of returns.
Trading expectancy is an estimate based on historical or hypothetical results. Actual outcomes may differ because of changing market conditions, liquidity, slippage, costs, execution and trader behaviour. Securities-market investments are subject to market risks. Conduct independent research and consult a SEBI-registered professional where appropriate.