

A consistent 1:2 risk-reward strategy needs a 33.33% win rate to break even before costs. It must win more than one out of every three trades for positive gross expectancy. After brokerage, statutory charges, spread and slippage, the required win rate will be higher.
In a hypothetical sample of 100 trades with identical outcomes, 33 wins are insufficient, while 34 wins produce a small gross profit. However, 34% is not necessarily enough after brokerage, statutory charges, bid-ask spread and slippage. The actual requirement must be calculated from realised average wins, realised average losses and total costs—not merely the target displayed on a chart.

Table of Contents
Author Observation: I used to feel pretty good about a trade whenever the potential profit looked twice as large as the amount I was risking. But I noticed I sometimes treated that ratio as if the trade was already in my favour. I remember taking a setup with a planned 1:2 risk-reward ratio and then getting frustrated when it failed. The ratio looked good on paper, but the trade itself still had to work. That was something I kept seeing in my own trades while reviewing them later.
Quick Answer: What Win Rate Is Required for a 1:2 Risk-Reward Ratio?
A trading strategy with a consistent 1:2 risk-reward ratio has a theoretical break-even win rate of 33.33% before costs. It must win more than one out of every three trades to have positive gross expectancy. After brokerage, statutory charges, spread and slippage, the required win rate will be higher. The exact percentage depends on actual cost per trade.
- 33 wins out of 100: gross loss
- 33%: mathematical break-even
- 34 wins out of 100: small gross profit
- 40 wins out of 100: +0.20R gross expectancy per trade
What Does a 1:2 Risk-Reward Ratio Mean?
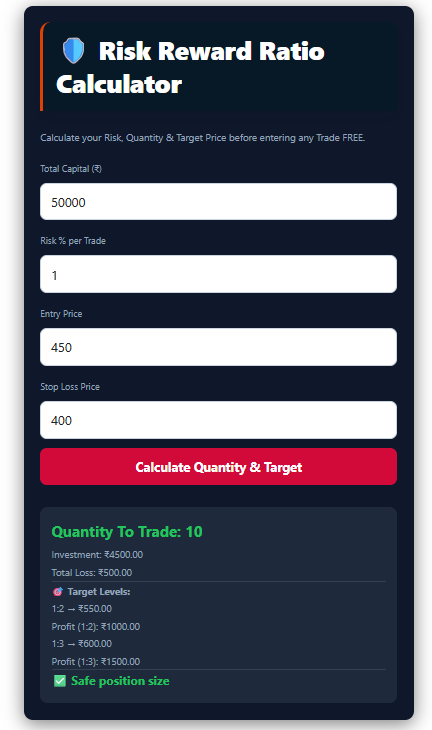
A 1:2 risk-reward ratio means the planned loss is one unit of risk and the planned profit is two units. If ₹500 is at risk, the planned reward is ₹1,000. It becomes a realised 1:2 result only if average winners actually earn 2R and average losses remain limited to 1R.
A target placed twice as far from entry as the stop does not prove that price will reach it.
How Is the Break-Even Win Rate Calculated?
Break-even win rate is the percentage at which total winning results equal total losing results before costs. For a 1:2 risk-reward ratio it is 1 divided by 3, or 33.33%. Profitability begins only above this percentage before costs.
Why Do Some Traders Say You Need a 34% Win Rate?
The exact mathematical break-even rate is 33.33%, but a trader cannot win one-third of an individual trade. In a simplified 100-trade sample, 33 wins lose 1R, while 34 wins gain 2R before costs. Therefore, 34 wins create a small gross profit—not guaranteed net profitability.
| Wins | Losses | Gross result at 1:2 | Outcome |
|---|---|---|---|
| 30 | 70 | 60R − 70R = −10R | Loss |
| 33 | 67 | 66R − 67R = −1R | Loss |
| 34 | 66 | 68R − 66R = +2R | Small gross profit |
| 40 | 60 | 80R − 60R = +20R | Gross profit |
| 50 | 50 | 100R − 50R = +50R | Gross profit |
Can a 40% Win Rate Be Profitable With a 1:2 Ratio?
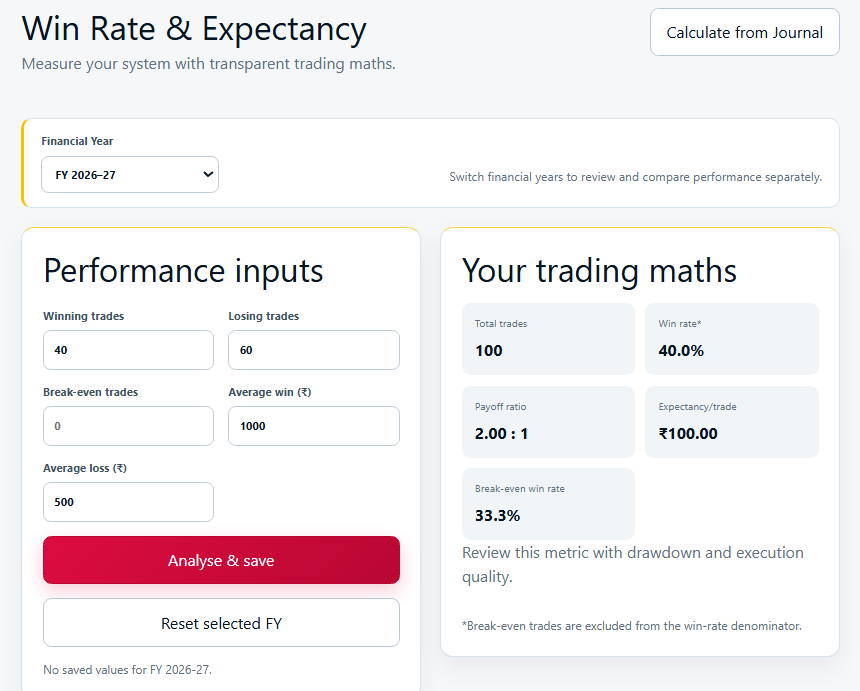
A strategy with a 40% win rate, 2R realised average win and 1R average loss has positive gross expectancy of 0.20R per trade. This assumes consistent outcomes and excludes costs. A planned 2R target is insufficient if the actual average winner is lower.
Worked Example: ₹500 Risk and ₹1,000 Reward
This is an illustrative example, not a backtest, trade record or profit projection.
| Input | Illustrative value |
|---|---|
| Total trades | 100 |
| Wins | 40 |
| Losses | 60 |
| Average winner | ₹1,000 |
| Average loser | ₹500 |
| Risk-reward ratio | 1:2 |
What Win Rate Is Needed After Trading Costs?
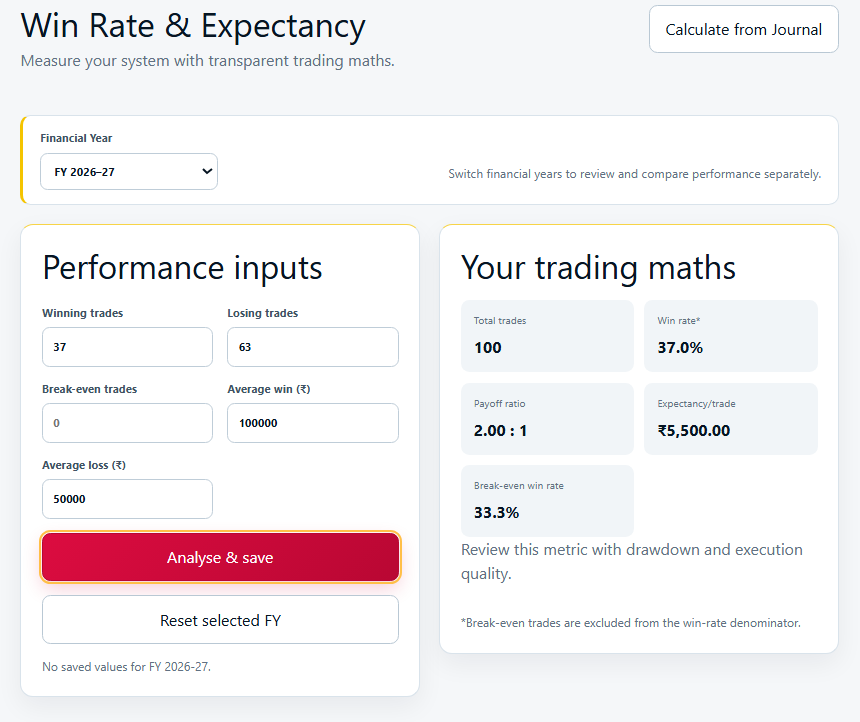
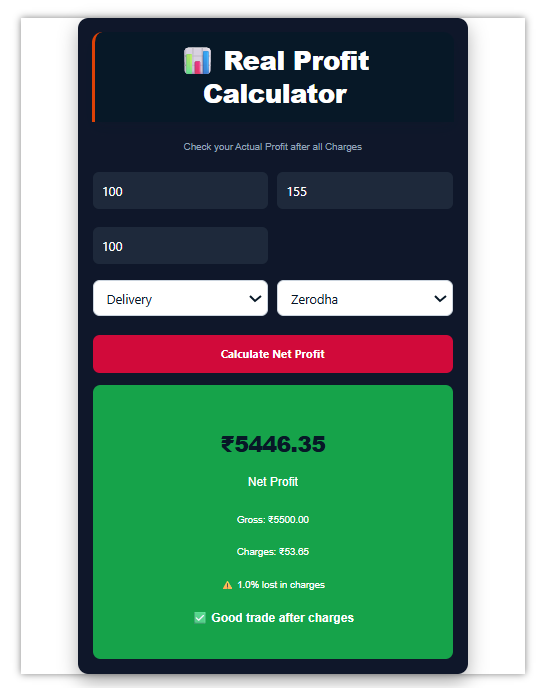
The break-even win rate becomes higher than 33.33% after costs. If average cost is 0.10R per completed trade, a simplified model produces a 36.67% break-even rate. The actual requirement depends on the instrument, broker, turnover and execution.
The ₹50 cost is an assumption, not a standard Indian trading cost. NSE’s investor material identifies brokerage and statutory levies among costs investors should understand.
Why Does Slippage Matter?
Slippage can reduce average winners, enlarge average losses or do both, raising the required win rate. Liquidity, order size and available orders affect execution cost, so the target and stop shown before entry may not match realised average outcomes.
Planned Risk-Reward Versus Realised Risk-Reward
| Measurement | Planned ratio | Realised ratio |
|---|---|---|
| Input | Entry, stop and target | Actual closed-trade results |
| Winner | Intended target | Average realised winning result |
| Loss | Intended stop | Average realised losing result |
| Costs | Often omitted | Should be included |
| Main use | Evaluating a proposed trade | Evaluating strategy performance |
| Limitation | Target may not be reached | Historical sample may not continue |
For strategy evaluation, realised results are more informative than planned targets.
What If Profits Are Booked Before the 2R Target?
If trades are frequently closed before 2R, the actual average winner will be below 2R and the required win rate will rise. With a realised 1.5R average winner and 1R average loss, the gross break-even win rate is 40%, not 33.33%.
How Should Scratch Trades Be Included?
Scratch trades should remain in the total sample because they consume an opportunity and may still incur costs. The direct-average method includes winners, losers, scratch trades and costs by dividing total net result by total closed trades.
Is a 1:2 Ratio Always Better Than 1:1?
A 1:2 ratio is not automatically better than 1:1 because increasing the target distance can reduce the probability of reaching it. The useful ratio is the one supported by the setup’s realised data after costs, not the ratio that looks most attractive before entry.
| Risk-reward ratio | Gross break-even win rate |
|---|---|
| 1:0.5 | 66.67% |
| 1:1 | 50.00% |
| 1:1.5 | 40.00% |
| 1:2 | 33.33% |
| 1:3 | 25.00% |
| 1:4 | 20.00% |
When Can the 33.33% Rule Mislead You?
The strategy rarely reaches 2R
The formula assumes the average winner is 2R—not merely that the target was placed at 2R.
Losses exceed 1R
Gaps, illiquidity or delayed exits can enlarge the average loss.
Costs are ignored
A small gross edge may disappear after expenses.
The sample is too small
One unusual result can dominate the average.
Different strategies are combined
A mixed result may describe none of the strategies accurately.
Position risk is inconsistent
Raw rupee averages can mislead when trade risk varies.
Valid losses are excluded
Removing losses artificially improves win rate and expectancy.
Market conditions changed
Historical relationships may weaken in another regime.
How to Check Whether Your 1:2 Strategy Is Actually Profitable
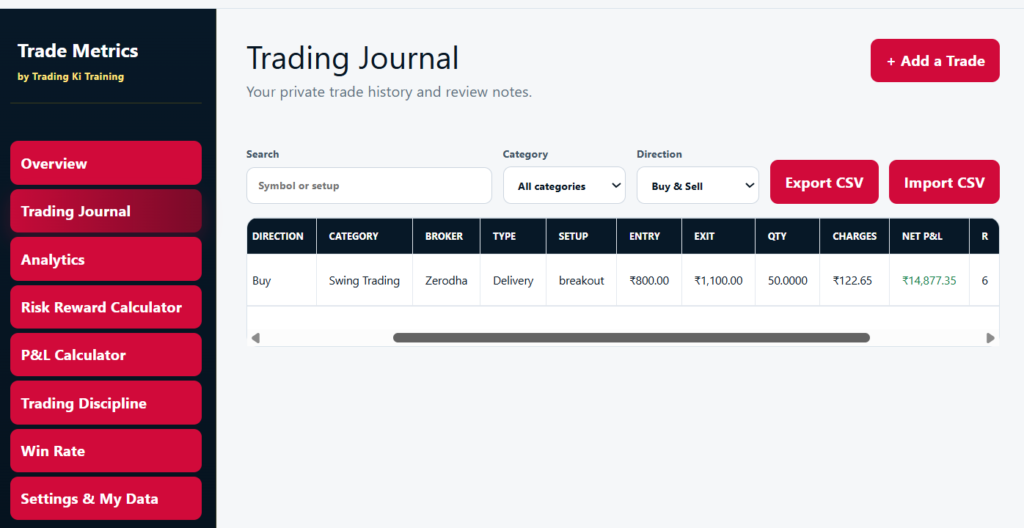
- Select closed trades from one clearly defined setup.
- Keep backtested, paper and live trades separate.
- Record initial rupee risk and realised R.
- Include all valid wins, losses and scratch trades.
- Calculate realised average win and average loss.
- Subtract brokerage, statutory charges and slippage.
- Calculate net expectancy.
- Compare rolling results and market regimes.
Common Mistakes With a 1:2 Ratio
- Treating 33.33% as profitable instead of gross break-even.
- Calling 34% universally profitable without considering costs.
- Using planned targets instead of realised average winners.
- Ignoring partial exits and scratch trades.
- Calculating the stop only from the desired ratio.
- Widening the stop after entry.
- Forcing every setup to show 1:2.
- Mixing unrelated strategies.
- Treating positive expectancy as guaranteed income.
- Ignoring the sequence of wins and losses.
Key Takeaways
- A 1:2 ratio has a 33.33% theoretical gross break-even win rate.
- The win rate must be above 33.33% before costs.
- In a 100-trade illustration, 34 wins produce a small gross profit.
- A 0.10R assumed cost raises simplified break-even to 36.67%.
- The realised average winner must actually be 2R.
- Partial exits can reduce the realised payoff.
- A 1:2 target does not guarantee profitability.
- Use net journal results from one defined setup.
The 33.33% threshold applies only when the average realised winner is 2R, the average loss is 1R and costs are excluded. Actual results can differ because of execution, liquidity, partial exits, gaps and changing market conditions.
Methodology and Limitations
The article uses mathematical and hypothetical examples rather than a real trade record. The main illustration assumes a 2R average winner, 1R average loss, 100 trades, ₹500 initial risk and ₹1,000 reward. The ₹50 cost is used only as an assumption. The examples do not account for changing size, correlated trades, varying liquidity or different regimes. Historical or hypothetical expectancy does not guarantee future profitability.
This material is for educational purposes only and does not constitute investment advice, a trading recommendation or a guarantee of returns.
Securities-market investments are subject to market risks. Conduct independent research and consult a SEBI-registered professional where appropriate.