

Confluence in the stock market refers to the alignment of various technical indicators, chart patterns, and price levels that support a specific trade decision. Traders who use confluence strategies believe that when multiple indicators agree, the chances of a successful trade increase. This approach provides more confidence and clarity, especially in volatile market conditions. In this guide, we will explore how to leverage confluence for winning moves in the stock market.
Table of Contents
Introduction: What is Confluence in Stock Market?
Confluence occurs when multiple factors—technical indicators, chart patterns, and key price levels—align to suggest a higher probability of a successful trade. For instance, if a price is nearing a support level and technical indicators like RSI and MACD are signaling oversold conditions, traders see this as a confluence of signals suggesting a potential buying opportunity.
Understanding the Concept of Confluence
To understand confluence, it’s crucial to know the individual components involved in this strategy. It isn’t about relying on a single indicator but rather combining various tools to confirm the market trend. Traders often use moving averages, trendlines, Fibonacci retracements, and candlestick patterns together to identify potential entry and exit points.
Also Read: Stock Exchange
The Importance of Confluence in Stock Market Trading
While confluence involves multiple factors, it’s the choice of indicators that matters most. These indicators should complement each other, not conflict. Popular indicators include:
Moving Averages
Moving Averages help determine the market’s trend by smoothing out price data over a set period. By observing the relationship between short-term and long-term moving averages, traders can identify potential buy or sell signals. When a shorter moving average crosses above a longer one, it can indicate an upward trend, while a downward crossover might signal a bearish market.
Relative Strength Index (RSI)
RSI indicates overbought or oversold conditions by measuring the speed and change of price movements. When the RSI moves above 70, the asset may be considered overbought, suggesting a potential sell signal. On the other hand, if the value drops below 30, it may indicate that the asset is oversold, suggesting a potential buying opportunity.
Moving Average Convergence Divergence (MACD)
MACD signals momentum shifts by comparing the difference between a short-term and long-term moving average. A MACD crossover, when the shorter-term moving average crosses above the longer-term one, can signal upward momentum, while a cross below can indicate a downward trend.
The combination of these tools creates a strong foundation for making informed trading decisions.
Also Read: Nifty Expiry
Confluence Indicators: A Step Toward Winning Moves
Traders use several key indicators to create confluence in their strategies. Some of the most widely used indicators include:
Support and Resistance Levels
These levels often represent significant price points where the market tends to reverse. When combined with other indicators, they provide a solid basis for trade decisions. For example, a support level coupled with an RSI below 30 may signal a strong buying opportunity.
Candlestick Patterns
Patterns like engulfing candles or doji can confirm price action predictions when seen alongside other indicators. For example, a bullish engulfing pattern at a support level can validate a buying signal when combined with an oversold RSI and a favorable MACD crossover.
Moving Averages
A crossover of short-term and long-term moving averages is a reliable signal. This strategy can help traders identify major market turning points and trend direction. The moving averages help smooth out price action, reducing noise and enhancing the effectiveness of confluence strategies.
These indicators create a comprehensive strategy for stock market traders looking for winning trades.
How to Apply Confluence in Trading Strategies
Implementing it in your trading strategy involves combining two or more indicators to confirm your trade entry and exit. For example, if a stock is near a key support level, and the RSI indicates an oversold condition, you might consider this as confluence to enter a buy position.
Traders should also be cautious of false signals. For this reason, always combine your confluence strategy with proper risk management.
Also Read: ETFs
Benefits of Confluence in Stock Market Decisions
Using confluence in trading provides several benefits:
Higher Probability of Success
When multiple indicators point to the same trade direction, it increases the chances of success. For instance, if the price is near a key support level, the RSI is oversold, and the MACD shows upward momentum, all indicators align for a high-probability buy signal.
Reduced Risk
By confirming signals with various tools, traders can make more calculated decisions, thus reducing risk. With confluence, the chances of being caught in a false move are reduced, as multiple signals must align to validate a trade.
Improved Trade Accuracy
A confluence of signals often leads to better accuracy in predicting price movements. This allows traders to make well-informed decisions with greater confidence.
Common Mistakes to Avoid When Using Confluence
While confluence strategies are powerful, they are not foolproof. Common mistakes include:
Relying solely on one indicator can be risky, as it’s crucial to use several indicators for confirmation. Relying on just one could lead to misleading decisions. Relying on a single tool like the RSI might not account for broader market trends, leading to false signals.
Ignoring Market Conditions: Confluence doesn’t always guarantee success if broader market conditions are unfavorable. Always consider the overall trend. For example, if the market is in a strong downtrend, an overbought RSI may not be as reliable for a reversal signal.
Also Read: Sector Rotation
Confluence and Risk Management
Risk management is essential, even when applying it. For example, using stop-loss orders to limit potential losses is a smart strategy. Traders should also consider position sizing to ensure that a series of losing trades won’t deplete their capital. Managing risk properly allows traders to stay in the market long-term, even if individual trades do not go in their favor.
Using Technical Analysis for Better Stock Market Decisions
Technical analysis is essential for spotting areas of it. By studying past price trends, chart formations, and trading volume, traders can make more educated forecasts. Combining these methods with additional indicators provides a broader perspective on potential market trends. This approach provides a comprehensive picture of market behavior, which helps traders make smarter decisions.
Combining Technical and Fundamental Analysis
While it is a technical approach, it can also be paired with fundamental analysis for a more robust strategy. On the other hand, fundamental analysis focuses on assessing a company’s financial strength and market standing. When confluence indicators align with positive fundamental data, it strengthens the case for a potential trade.
For instance, if a stock’s earnings reports are positive and technical indicators like RSI and MACD confirm upward momentum, this creates a strong case for entering a long position.
Also Read: Double Bottom
Psychology of Trading and the Role of Market Factors
The psychology of trading plays a pivotal role in how traders apply it. Emotional decision-making can often cloud judgment. However, having a clear, structured strategy like confluence helps mitigate this risk. By sticking to rules and confirming trades through multiple indicators, traders can avoid impulsive decisions driven by fear or greed.
Developing a Long-Term Confluence Strategy
Developing a long-term strategy based on it is crucial for sustained success. It’s not about short-term wins but creating a reliable trading system that works over time. Long-term traders often rely on broader market indicators, combining them with confluence principles to ensure consistency.
Patience and discipline are key to this approach. As with any form of trading, being able to stick to a well-defined plan, even through market volatility, is critical for long-term success.
Also Read: Double Top
Conclusion: Mastering Winning Moves in the Stock Market
Mastering confluence in stock market trading takes time and practice. By understanding the concept and applying it alongside other trading strategies, you can improve your chances of success. It enables you to make more informed, confident trading decisions. Stick to your strategy, manage your risk, and embrace the power of confluence for consistent trading success.
FAQs About Stock Market Trading
Q1: How do I find confluence in the stock market?
It is found by combining multiple indicators, such as support/resistance levels, moving averages, and momentum indicators like RSI and MACD.
Q2: Can I rely solely on confluence for stock trading?
While it helps confirm trade signals, it’s essential to also consider market conditions, economic news, and risk management strategies.
Q3: What are the best confluence strategies for beginners?
New traders should begin with straightforward combinations, such as moving averages and RSI, to help confirm their decisions. This basic confluence approach can be effective for entry-level traders.
Also Read: Gift Nifty

Why Is My DP Charge Missing From the Contract Note but Showing in the Funds Ledger?
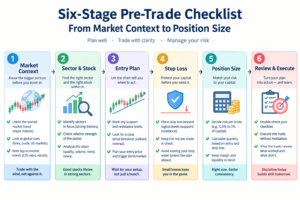
A Beginner’s Pre-Trade Checklist: Market, Sector, Stock, Entry, Stop and Size
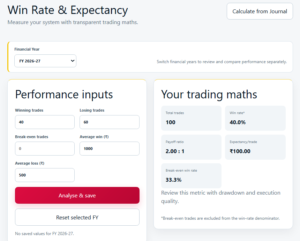
Trading Expectancy Explained: Can a 40% Win-Rate Strategy Still Make Money?


How Much Should You Risk Per Trade? Position Sizing for a ₹50,000 Account