A promising trade setup can still damage your account if the position is too large.
Suppose you identify an entry at ₹250 and place a stop-loss at ₹245. You then buy as many shares as your available capital allows. If the stop is triggered, the loss turns out to be twice what you were prepared to accept.
The problem was not necessarily your setup. It was your position size.
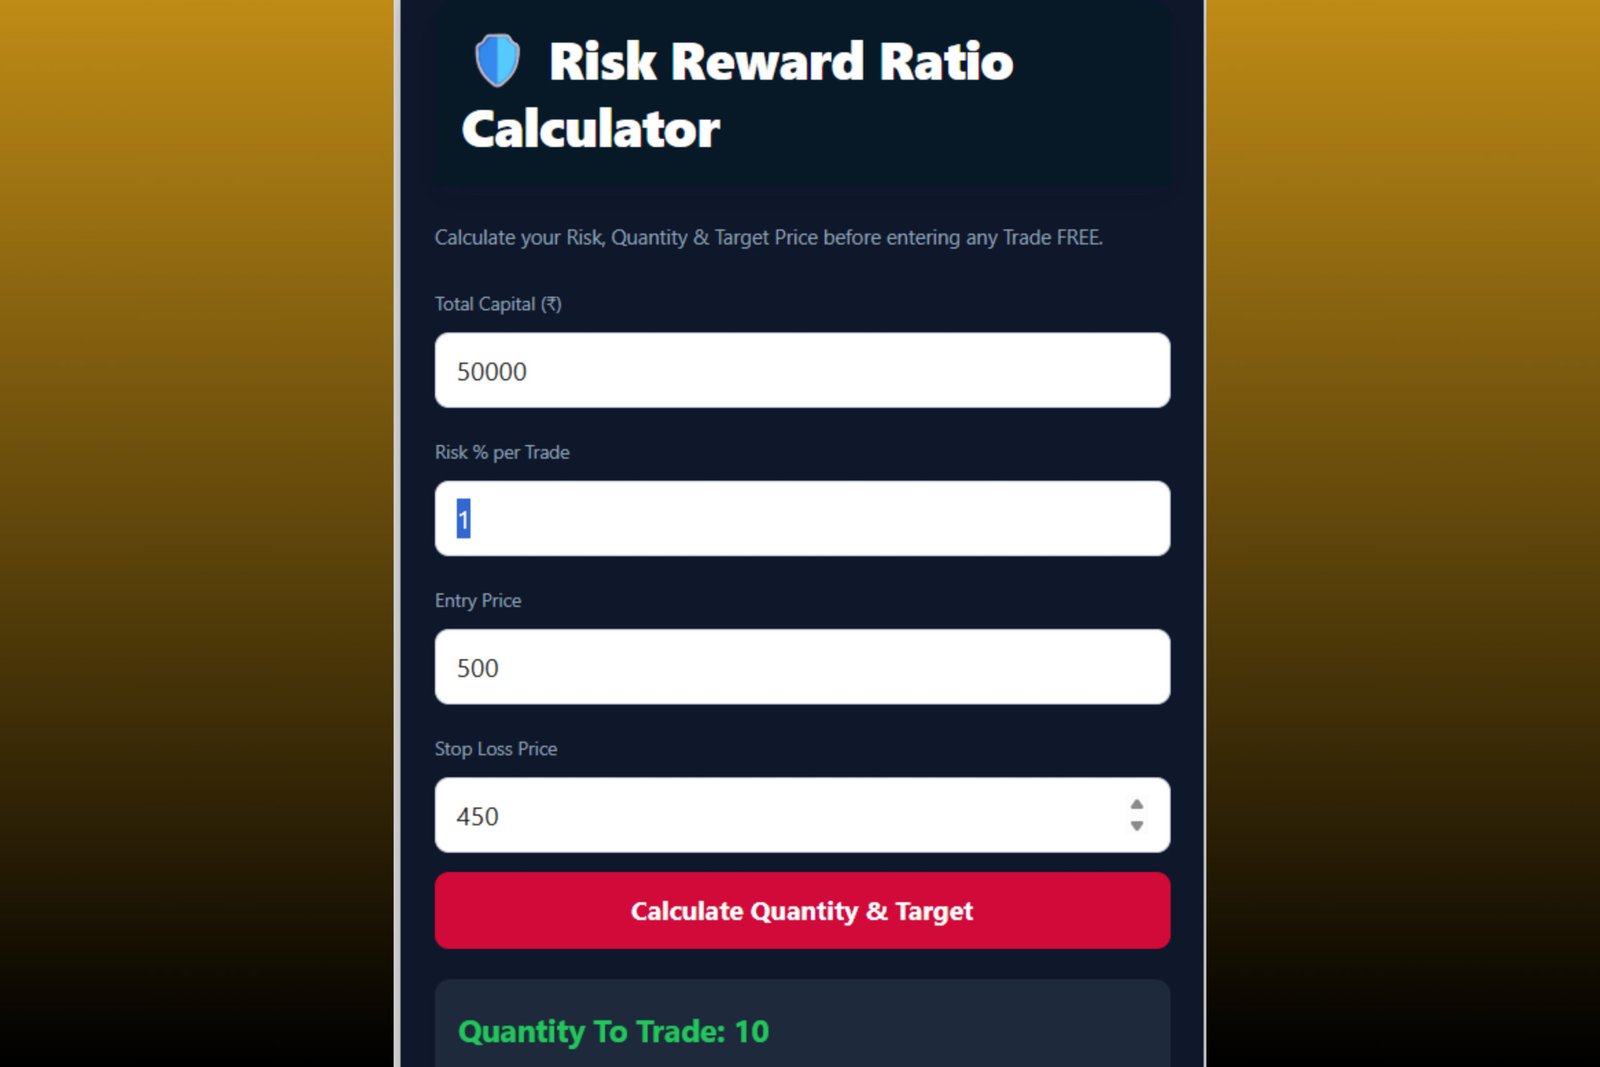
Position sizing determines how many shares you can buy while keeping the planned price-based loss within a predefined rupee amount. For a ₹50,000 account, an illustrative risk limit of 1% equals ₹500. However, 1% is not a universal recommendation or a percentage prescribed by SEBI.
This guide explains how to calculate quantity, check affordability and account for costs, slippage, gaps and multiple open positions.
Author Observation: When I was new to trading, I would check my balance and quickly work out how many shares I could buy. I didn’t always think about the stop-loss at the same time. If ₹20,000 was available, buying ₹15,000 or ₹18,000 worth of a stock didn’t feel like a big deal. The problem showed up when I calculated the loss at the stop. I’ve noticed beginners make this mistake quite often. The stock being affordable doesn’t necessarily mean the position is small.
Table of Contents
What Is Position Sizing in Trading?
Position sizing is the process of deciding how many shares or units to trade based on the amount you are prepared to lose and the distance between your entry and stop-loss. Its purpose is to stop one unsuccessful trade from causing disproportionate damage to your account.
Position sizing does not predict whether a trade will be profitable. It controls planned exposure when the trade goes against you.
SEBI’s investor guidance advises people to select products according to their objectives and risk appetite. It does not prescribe a single percentage that every trader should risk. See “Sources and Further Reading.”
How Much Should You Risk Per Trade?
There is no universally correct risk-per-trade percentage. A lower percentage reduces the effect of each losing trade but also produces a smaller position. An appropriate limit depends on your financial circumstances, risk tolerance, experience, strategy, existing positions and the possibility of gaps or slippage.
These are educational examples—not recommendations. Risking ₹500 does not guarantee that the final loss will remain within ₹500. A stop-loss can execute at a worse price because of an overnight gap, rapid price movement, poor liquidity or slippage.
| Illustrative risk limit | Planned rupee risk |
|---|---|
| 0.25% | ₹125 |
| 0.50% | ₹250 |
| 1.00% | ₹500 |
| 2.00% | ₹1,000 |
Position-Sizing Formula
Step 1: Calculate rupee risk
Step 2: Calculate risk per share
Step 3: Calculate risk-based quantity
Round fractional quantities down. If the answer is 83.7 shares, use 83—not 84.
Step 4: Check affordability
This formula calculates intended price risk. Charges and adverse execution must be considered separately.
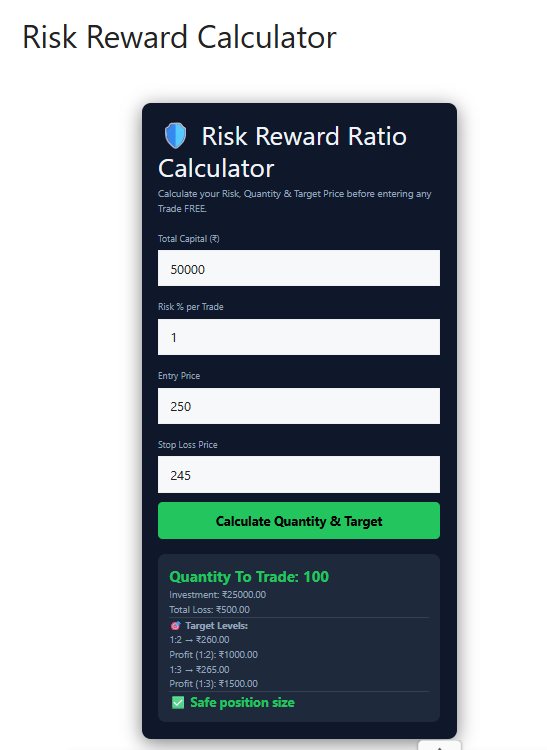
Worked Example: Position Sizing for a ₹50,000 Account
- Account capital: ₹50,000
- Illustrative risk limit: 1%
- Entry price: ₹250
- Stop-loss price: ₹245
| Input | Value |
|---|---|
| Account capital | ₹50,000 |
| Illustrative risk | 1% |
| Rupee-risk budget | ₹500 |
| Entry | ₹250 |
| Stop-loss | ₹245 |
| Risk per share | ₹5 |
| Risk-based quantity | 100 |
| Capital required | ₹25,000 |
| Intended price loss | ₹500 |
This is an illustrative calculation. The actual exit price and net loss may differ.
Why Affordability and Position Risk Are Different
Affordability tells you how many shares you can pay for; position sizing tells you how many shares fit within your risk limit. A quantity can be affordable while still exposing the account to an unacceptable loss.
Although 200 shares are affordable, they create a planned price loss of ₹1,000—twice the illustrative ₹500 risk budget.
Buying 200 shares uses the available capital but doubles the illustrative ₹500 risk budget. Always calculate both quantities and select the lower one.
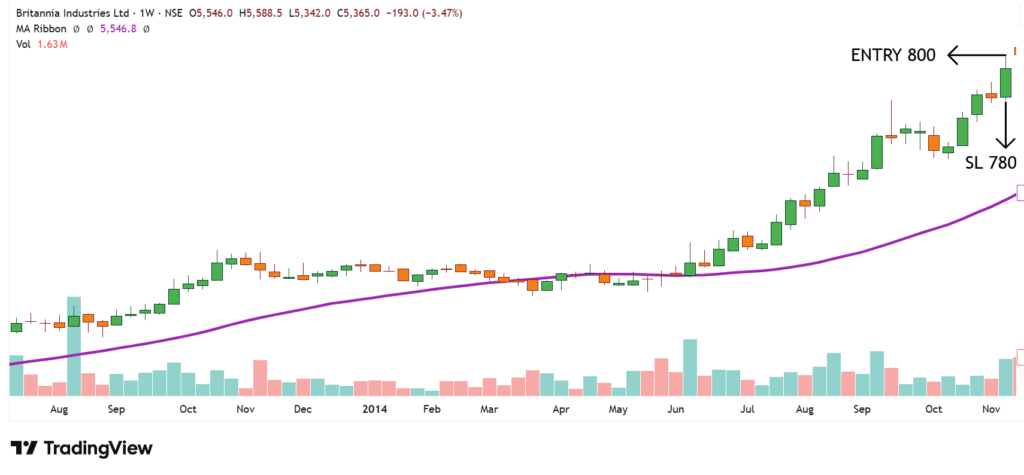
How Does a Wider Stop-Loss Change Position Size?
When the rupee-risk budget remains unchanged, a wider stop-loss requires a smaller position. This allows the stop to be placed at a valid trade-invalidation level without automatically increasing account risk.
Do not move a stop artificially closer merely to increase quantity. First identify the price at which the trade idea becomes invalid; then calculate the appropriate position.
Should Brokerage and Other Trading Costs Be Included?
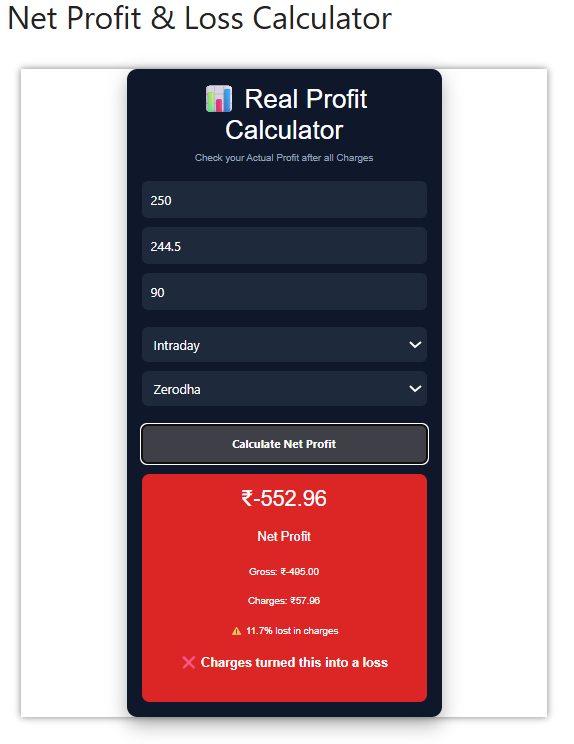
Yes. A calculation using only entry and stop prices does not represent the complete net loss. Brokerage, Securities Transaction Tax, exchange charges, GST, SEBI charges, stamp duty and slippage can change the final outcome.
The exact costs depend on the broker, instrument and transaction type. Verify current rates before publishing a cost-specific example.
Method 1: Reduce the usable price-risk budget
Method 2: Use a buffered exit assumption
Neither method guarantees the final loss. Actual execution remains uncertain.
Why Can the Actual Loss Exceed the Planned Risk?
Actual loss can exceed calculated risk because a stop-loss trigger does not guarantee execution at the same price. Price gaps, slippage, low liquidity, order failure and transaction costs can produce a worse result than the model assumes.
A stop-loss trigger does not guarantee execution at the same price. Price gaps, slippage, poor liquidity, order failure and transaction costs can produce a larger loss than the calculation assumes.
Overnight gaps
A stock may close above the stop-loss and open below it after company news or a market-wide event.
Slippage
During rapid movement, the order may execute at a price different from the expected stop price.
Poor liquidity
A wide bid-ask spread or insufficient market depth can prevent the full position from exiting near the intended level.
Operational problems
Connectivity issues, order rejection or system disruption can delay an exit.
Charges and taxes
A ₹500 price loss becomes a larger net loss when charges are included.
What Happens After Consecutive Losses?
Position sizing cannot prevent a losing streak. It can, however, influence how quickly the account declines. The illustration assumes the risk percentage is recalculated after each loss and ignores charges.
| Risk per trade | Balance after five losses | Drawdown |
|---|---|---|
| 0.5% | ₹48,762 | 2.48% |
| 1.0% | ₹47,550 | 4.90% |
| 2.0% | ₹45,196 | 9.61% |
This table does not predict strategy performance. It only illustrates the mathematical effect of different position sizes.
| Account drawdown | Gain required to recover |
|---|---|
| 10% | 11.11% |
| 20% | 25.00% |
| 30% | 42.86% |
| 50% | 100.00% |
How Should Risk Be Managed Across Several Open Positions?
Portfolio risk is the combined planned risk across all open trades, not merely the risk attached to the newest order. Correlated positions can increase exposure because one sector or market event may affect several trades simultaneously.
This combined planned exposure is sometimes called portfolio heat. Three banking stocks should not automatically be treated as three independent risks.
- How much planned risk is already open?
- Are several positions in the same sector?
- Could one event affect multiple trades?
- Have costs and adverse execution been considered?
- Does the new trade breach my portfolio-level limit?
There is no universal portfolio-heat percentage suitable for every trader.
When May This Method Not Work as Expected?
During price gaps
The position may exit well beyond the planned stop.
In illiquid securities
The displayed market price may not be available for the entire quantity.
During major events
Results announcements, regulatory decisions and unexpected news can cause abnormal movement.
When stops are discretionary
If the trader repeatedly moves or ignores the stop, the initial quantity no longer represents final risk.
In futures and options
When account capital is not risk capital
Money required for living expenses, emergencies, debt repayment or near-term goals should not be treated as trading capital.
Common Position-Sizing Mistakes
Selecting quantity before identifying the stop
Setup → Invalidation level → Stop-loss → Risk per share → Position quantity
Maximum affordable quantity → Stop-loss adjusted to fit the desired quantity
Rounding quantity up
If the formula produces 83.7 shares, rounding to 84 slightly exceeds intended price risk.
Trading the same quantity in every stock
The same number of shares can represent different risk when price, volatility and stop distance differ.
Tightening the stop to buy more shares
A stop inside ordinary market movement may be triggered even when the setup remains valid.
Ignoring trading costs
Position size based solely on price difference can understate possible net loss.
Ignoring existing positions
Several individually acceptable trades can create excessive combined exposure.
Treating the stop price as guaranteed
The trigger price and execution price can differ.
Position-Sizing Checklist
- ☐ Current account capital
- ☐ Acceptable rupee-risk budget
- ☐ Entry price
- ☐ Logically justified stop-loss
- ☐ Risk per share
- ☐ Risk-based quantity
- ☐ Affordable quantity
- ☐ Final lower quantity
- ☐ Estimated trading charges
- ☐ Slippage or gap buffer
- ☐ Risk already open in other trades
- ☐ Sector or correlation exposure
- ☐ Intended exit-order type
- ☐ Conditions that invalidate the setup
Methodology and Limitations
The calculations in this guide use hypothetical cash-equity trades and a ₹50,000 account. They are not historical market data or backtests and do not demonstrate expected profitability.
- Define an illustrative rupee-risk budget.
- Calculate entry-to-stop distance.
- Divide rupee risk by risk per share.
- Round the result down.
- Compare it with affordable quantity.
- Use the lower quantity.
- Separately consider costs, slippage and portfolio exposure.
The model assumes expected entry execution, an unchanged stop, sufficient liquidity, whole cash-equity shares and adherence to the planned exit. Actual conditions can violate any assumption.
Key Takeaways
- Base position size on acceptable rupee risk and stop distance—not confidence.
- For ₹50,000, an illustrative 1% equals ₹500, but 1% is not a universal rule.
- Calculate risk-based and affordable quantities, then use the lower number.
- Round quantity down.
- Allow for costs and adverse execution.
- Actual loss can exceed planned risk.
- Calculate combined risk across all open positions.
- Position sizing controls exposure; it cannot make an unprofitable strategy profitable.
Final Note
No position-size formula removes market risk. Its purpose is to make the potential effect of an unsuccessful trade visible before entry.
The useful long-term habit is not searching for a perfect percentage. It is consistently defining risk, calculating quantity, recording actual execution and comparing planned losses with realised losses.
Author Observation: I still remember a few trades where I was quite sure about the setup and wanted to take a bigger quantity. Once I worked out the rupee risk, though, the numbers didn’t look as comfortable. Sometimes I cut the quantity. Sometimes I skipped the trade altogether. I’ve become much more comfortable doing that now. Missing one trade bothers me far less than taking a position that is larger than I intended.
This article is for educational purposes only and does not constitute investment advice, a trading recommendation or a guarantee of returns.
Securities-market investments are subject to market risks. Actual losses may exceed planned losses because of price gaps, liquidity, slippage, charges and execution conditions. Conduct your own research and consult a SEBI-registered professional where appropriate.