
Owning or trading five stocks can feel diversified. But if all five respond to the same market move, sector news, interest-rate expectation, commodity price or institutional flow, the portfolio may behave like one oversized trade. That hidden overlap is correlation risk in trading. It becomes especially important when several positions are long in the same sector or are opened from the same setup at the same time.
Table of Contents
Quick answer: Correlation risk in trading is the danger that separate positions move together because they share a market, sector, factor or event driver. Five trades do not automatically equal five independent bets. If several positions are likely to lose at the same time, traders should assess them as a cluster and control the cluster’s total exposure, not only each trade’s individual risk.
Key takeaways
- More stocks do not always mean more diversification.
- Correlation is historical and can change, particularly during market stress.
- Use returns—not raw prices—when calculating ordinary return correlation.
- Measure portfolio heat and correlation risk separately; neither replaces the other.
- Group positions by common drivers and set a risk limit for each cluster.
Also Read: Triangle Chart Pattern
What is correlation risk in trading?
Correlation risk arises when positions expected to be separate actually share enough drivers to move together. A correlation coefficient is commonly expressed from −1 to +1: +1 means perfect same-direction co-movement in the observed sample, 0 means no linear relationship, and −1 means perfect opposite-direction co-movement. Real markets rarely remain at these extremes.
Important: A correlation figure describes a past relationship over a chosen dataset and interval. It does not prove causation, predict the next move or guarantee that the relationship will remain stable.
Also Read: BTST Strategy
Why five stocks can become one big bet
Positions can share risk even when the company names are different. The overlap may be obvious, such as five banking stocks, or indirect, such as an airline, paint company and tyre manufacturer that are all sensitive to crude-oil costs.
| Common driver | How separate positions can overlap |
|---|---|
| Sector | Banks may react together to rate, credit-growth or asset-quality expectations. |
| Broad market | High-beta stocks may fall together when the index or risk appetite weakens. |
| Commodity or currency | Several businesses may share exposure to crude oil, metals or the rupee. |
| Event | A Budget announcement, regulation or earnings theme may affect a group simultaneously. |
| Setup and timing | Trades triggered by the same breakout pattern can fail together in a market reversal. |
| Liquidity | During a sharp sell-off, exits can become difficult across multiple positions. |
Also Read: Trend Reversal
Correlation, concentration and diversification are not the same
| Concept | What it tells you | What it does not tell you |
|---|---|---|
| Correlation | How two return series moved together in a selected sample. | The exact loss that will occur next. |
| Concentration | How much capital or risk is exposed to one stock, sector, factor or idea. | Whether those holdings will always move together. |
| Diversification | How risk is spread across genuinely different exposures. | That losses are impossible or that market-wide risk disappears. |
| Portfolio heat | The planned rupee loss if all current stops are hit, before gaps and slippage. | The probability that every stop will be hit together. |
SEBI’s investor education material recommends diversification across genuinely different assets and also notes that market-wide volatility cannot be diversified away. For a trader, that means diversification must be judged by underlying exposure—not by ticker count alone.
Worked example: five positions with ₹1,000 risk each
Illustrative calculation
Portfolio heat = 5 × ₹1,000 = ₹5,000
To show how shared movement changes a portfolio’s variability, we can use a simplified equal-risk, equal-correlation proxy:
Simplified educational formula
Combined risk proxy = R × √[n + ρn(n − 1)]
R = equal standalone risk unit | n = number of positions | ρ = assumed average pairwise correlation
| Average correlation (ρ) | Illustrative combined proxy | Effective independent bets* |
|---|---|---|
| 0.00 | ₹2,236 | 5.00 |
| 0.25 | ₹3,162 | 2.50 |
| 0.50 | ₹3,873 | 1.67 |
| 0.75 | ₹4,472 | 1.25 |
| 1.00 | ₹5,000 | 1.00 |
Equal-correlation simplification
Neff = n ÷ [1 + (n − 1)ρ]
For n = 5 and ρ = 0.50: Neff = 5 ÷ 3 ≈ 1.67 independent bets
What the example means: At an assumed average correlation of 0.50, five nominal positions behave like roughly 1.67 independent bets in this simplified framework. The crucial lesson is not the exact rupee number; it is that shared movement can erase much of the diversification that stock count appears to provide.
Limitation: This is an educational volatility-style proxy—not maximum loss, Value at Risk, a stop-loss forecast or a trading recommendation. Correlation is estimated from historical data and can change.
Also Read: Candlestick Trading
How to calculate correlation risk in trading
A spreadsheet can calculate Pearson correlation, but the input choices matter more than the button or formula.
- Choose a frequency that fits the holding period. An intraday trader may examine suitably cleaned intraday returns; a swing trader may start with daily returns.
- Use percentage or logarithmic returns, not raw share-price levels. Two rising price series can look related even when their returns are not.
- Align timestamps and trading dates. Remove or handle missing observations consistently.
- Calculate the pairwise correlation matrix for all open or proposed positions.
- Repeat the calculation using rolling windows. A single full-period value can hide recent change.
- Compare normal and stressed periods, then inspect the economic reason behind each apparent relationship.
Pearson correlation is the covariance of two return series divided by the product of their standard deviations. It captures linear co-movement. It can miss nonlinear relationships, asymmetric reactions and joint losses that occur mainly in the tails.
Also Read: Trading Mistakes
Why correlation may rise when you need diversification most
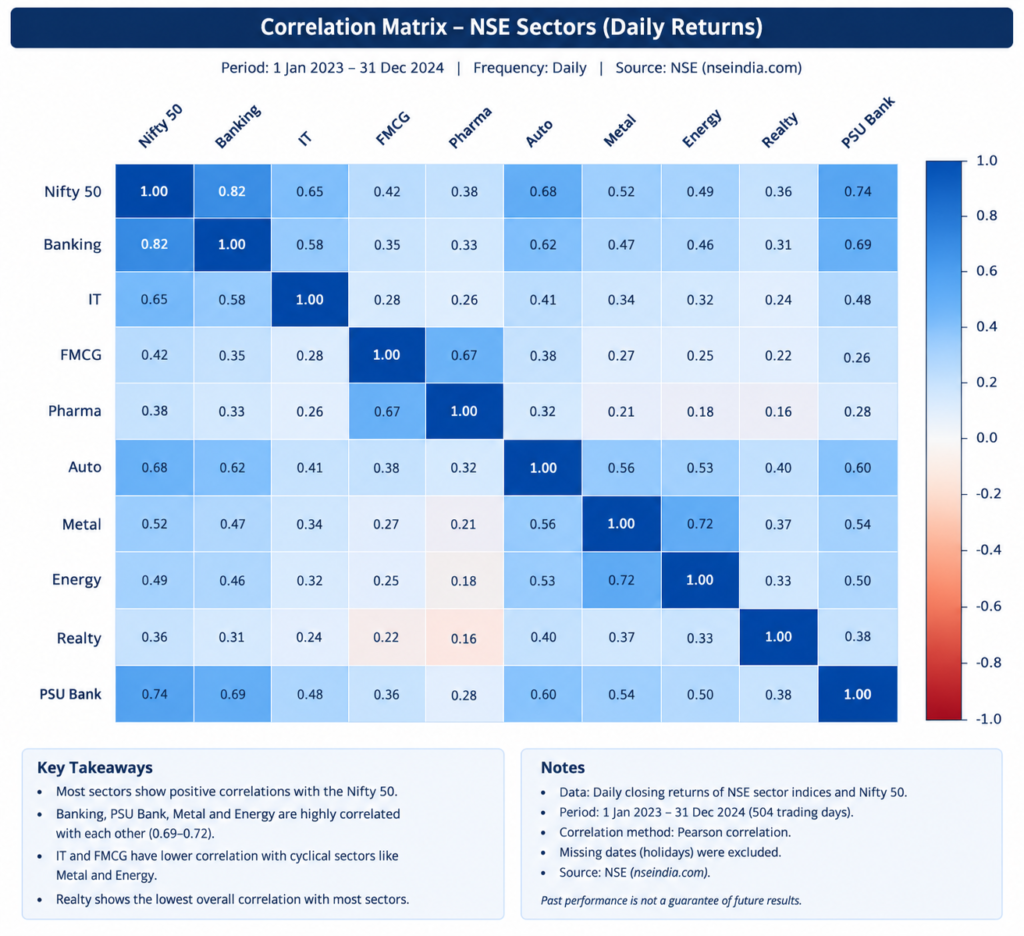
During broad risk-off moves, company-specific differences can matter less than the common market driver. Historical Indian-market research supports this possibility but should not be treated as a timeless constant. A study of 201 frequently traded NSE stocks using daily data from January 1996 to May 2006 found a strong market-wide component in the correlation structure. Another study of BSE sector returns from April 2006 to March 2014 reported stronger cross-correlations in its more volatile 2006–2009 subperiod than in 2009–2013.
Evidence note: These studies use historical samples and different methodologies. They show why stress testing matters; they do not establish the current correlation of any stock or guarantee that every sell-off will produce the same pattern.
Also Read: Double Top
Seven ways a correlation matrix can mislead you
- Window dependence: 20-day and 250-day estimates can tell different stories.
- Regime change: policy, management, index membership or business mix can alter a relationship.
- Tail dependence: modest average correlation may hide simultaneous losses on extreme days.
- Direction mismatch: two positively correlated stocks can offset each other when one position is long and the other is short—but basis risk remains.
- Options exposure: delta, gamma, vega and expiry effects are not captured by a simple stock-return matrix.
- Illiquidity and stale prices: infrequent trades can distort measured correlation.
- False precision: a value such as 0.63 is an estimate, not a permanent property of the pair.
Also Read: Trendline
Portfolio heat is necessary—but not sufficient
Portfolio heat is the sum of planned rupee risk across open trades. If three positions each risk ₹1,000, the stated heat is ₹3,000. It remains useful because it answers a direct question: what is the planned loss if every stop is filled as expected?
Correlation answers a different question: how likely are positions to move together, based on the selected historical sample? Traders should monitor both. Stop-loss orders do not eliminate gaps, slippage, liquidity problems or simultaneous adverse moves.
Key distinction: Portfolio heat estimates the planned rupee loss if all stops are filled as expected. Correlation measures historical co-movement in a chosen sample. Traders should monitor both because stop-loss orders do not eliminate gaps, slippage, liquidity problems or simultaneous adverse moves.
Also Read: Smart Money Concept
A practical cluster-risk framework
Instead of searching for one perfect correlation threshold, group positions by their plausible common drivers before entry. A position may belong to more than one cluster.
| Cluster | Examples of a shared driver | Question before adding a trade |
|---|---|---|
| Banking/financials | Rates, credit cycle, liquidity, regulation | How much total planned loss is already tied to financial conditions? |
| Commodity-sensitive | Crude oil, metals, input-cost inflation | Are these positions all relying on the same commodity move? |
| Index/high beta | Broad risk appetite and institutional flows | Will an index reversal pressure the entire group? |
| Event/theme | Budget, regulation, election, earnings narrative | Could one announcement invalidate several trades together? |
| Same setup/timeframe | Breakouts or mean-reversion entries triggered together | Is this really one market-timing decision expressed through many stocks? |
Also Read: Backtesting
Pre-trade correlation-risk checklist
- What common sector, index, commodity, currency or event driver connects these positions?
- Are the positions mostly in the same direction and timeframe?
- What is the total portfolio heat if all planned stops execute?
- What is the heat within each risk cluster?
- What do short, medium and stress-period correlations show?
- Could a gap or liquidity shock make actual loss larger than planned?
- Would the new trade add a genuinely different source of return, or only more of the same bet?
- If the cluster moves against me, which position will I reduce first and why?
Also Read: Forward Testing
A realistic workflow for an Indian swing trader
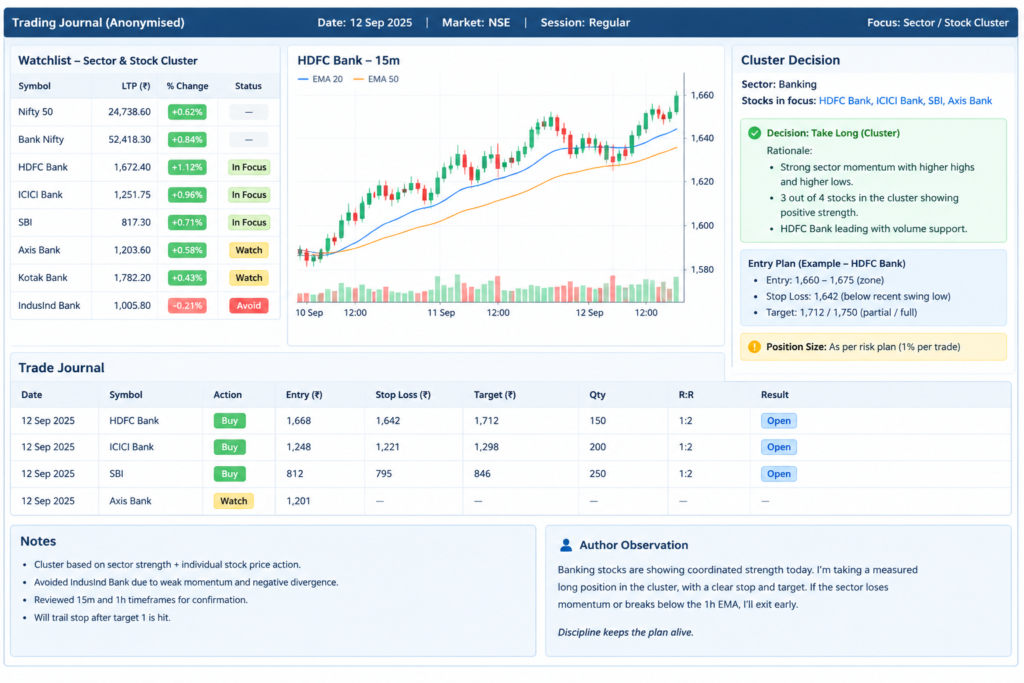
Suppose a trader already holds two private-bank longs and sees a third bank breakout. The new chart may be valid, but the decision should begin at portfolio level. The trader checks total bank-cluster heat, compares rolling correlations, reviews upcoming policy or results events, and asks whether reducing size—or skipping the trade—would keep the portfolio inside the written risk limit.
This does not mean correlated trades must always be rejected. It means their combined exposure should be intentional. A strong thesis expressed through three stocks can still be one thesis, and it should be sized accordingly.
Practical rule: Correlated trades do not always have to be rejected, but their combined exposure should be intentional. A strong thesis expressed through three stocks can still be one thesis, and it should be sized accordingly.
Author Observation: I’ve noticed that holding different stocks doesn’t always mean my money is spread across different risks. For example, a few stocks from the same sector can all react to the same market news. I used to look at each chart separately without paying enough attention to what was driving them together. When the broader market or sector moved against those positions, several trades could struggle at once. Since then, I’ve made a habit of checking whether my open trades depend on the same underlying factor before adding another position.
Also Read: Momentum
When this framework may not work well
- A short or poor-quality dataset can produce unstable estimates.
- Newly listed, illiquid or frequently suspended stocks may not provide reliable return histories.
- Options and hedged books need scenario analysis that includes changing Greeks and volatility.
- Correlation may break after corporate events or structural changes.
- Pairs with low average correlation may still fall together during a market shock.
- Transaction costs, taxes, slippage and gaps can dominate a neat spreadsheet estimate.
Treat correlation as one input to risk management, alongside position sizing, liquidity, event risk, maximum drawdown rules and scenario analysis. It is not a signal to buy or sell by itself.
Also Read: Morning Star & Evening Star
Frequently asked questions
Is correlation the same as causation?
Is 0.80 correlation always high?
Can negatively correlated positions remove risk?
No. Negative historical correlation may reduce observed variability, but the relationship can change. Gaps, liquidity, basis risk and nonlinear exposure can still create losses.
How many stocks are enough for diversification?
Stock count alone cannot answer this. Ten stocks driven by the same sector or market factor may be less diversified than a smaller set with genuinely different exposures.
Should intraday traders use daily correlation?
Daily data may miss intraday relationships. Use a clean interval that reflects the strategy’s holding period, and compare more than one window. Very short intervals may contain microstructure noise.
Do stop-losses eliminate correlation risk?
No. Several stops can trigger together, and actual fills may differ from stop prices during gaps or thin liquidity. Stops control planned trade risk; they do not guarantee the maximum realised loss.
Final takeaway: Count common drivers, not just stock names. Calculate portfolio and cluster heat, test correlations across different windows, and plan for relationships to change. The goal is to prevent an apparently diversified portfolio from becoming one accidental oversized bet.
Also Read: Bollinger Band
Sources and further reading
SEBI Investor — How to Manage Investment Risks — Investor education on diversification and market-wide risk.
SEBI Investor — Key Risks in Investing — Overview of market/systematic and securities-market risks.
NSE Indices — Index Methodology — Official methodology hub for broad-market and sectoral Nifty indices.
Sinha & Pan (2007) — Cross-correlation behaviour in the NSE — Historical study of 201 NSE stocks using 1996–2006 daily data.
Sharma & Banerjee (2015) — A Study of Correlations in the Stock Market — Historical BSE sector study using April 2006–March 2014 data.
Also Read: Nifty Reversal
Risk disclaimer
This article is for education only and is not investment advice, a recommendation, research report or assurance of returns. Correlation estimates are backward-looking and can change without warning. Trading and investing involve market, liquidity, execution and capital-loss risk. Readers should verify data independently and consult a SEBI-registered investment adviser where appropriate.
Also Read: Fibonacci Retracement