
Three or five losing trades in a row can make a trader question the strategy, the market, and personal ability at the same time. The streak may be ordinary variation in a valid method. It may also expose poor execution, excessive size, clustered setups, changed market conditions, or a strategy that was never tested properly. Streak length alone cannot tell you which explanation is correct.
Consecutive losses in trading should be handled in three stages: measure how unusual the sequence is for the strategy, calculate the damage to account equity, and audit why the losses occurred. This article gives the formulas, a worked Indian-rupee example, and a restart process. It does not offer a universal “stop after X losses” rule because the right response depends on the strategy, timeframe, costs, leverage, and the trader’s ability to follow the plan.
Quick answer: Consecutive losses in trading are two or more losing trades with no winning trade between them. A streak does not by itself prove that a strategy has stopped working. Compare it with the strategy’s documented loss rate and run distribution, then review execution, setup quality, costs, correlation, and market regime before deciding to continue, reduce size, pause, or retest.
Table of Contents
Also Read: Trend Reversal
What Counts as a Consecutive Trading Loss?
A consecutive loss is a closed trade recorded as a net loss under one consistent accounting rule. The sequence resets when a winning trade occurs. Decide in advance how scratches, partial exits, multi-leg strategies, and open trades are treated. Changing the definition after a difficult week makes the streak impossible to compare with historical data.
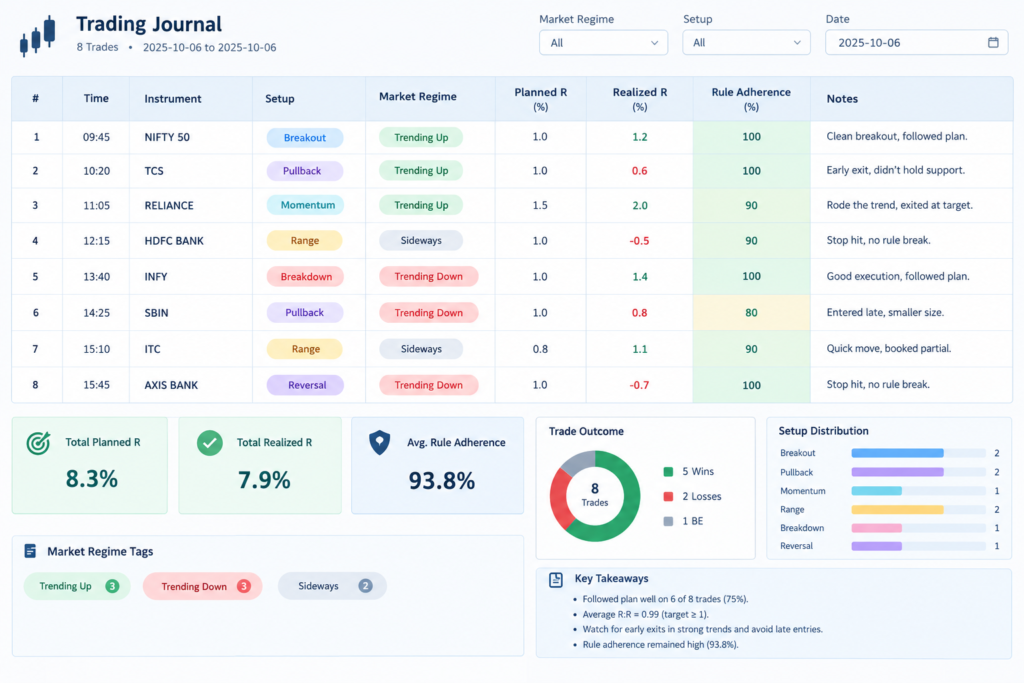
Use net outcomes after brokerage and applicable charges when your goal is account analysis. For strategy analysis, many traders also record R-multiples, where 1R is the planned initial risk. Keep planned R and realized R separate because a stop filled beyond the intended price can turn a planned -1R trade into a larger actual loss.
Also Read: Hedging
How Likely Is a Losing Streak?
If trades are assumed to be independent and the probability of a loss is q, the probability that the next n specified trades are all losses is q raised to n. That answers a narrow question about one particular sequence. It does not equal the probability of seeing at least one such run somewhere inside 100 or 500 trades; that requires a run calculation or simulation.
If q is the probability of one loss:
Probability of n specified consecutive losses = qn
Example: with a 50% loss probability, five specified trades all losing has probability 0.55 = 3.125%.
Yet there are many overlapping opportunities for a five-loss run to appear inside 100 trades. An exact run-state calculation gives about an 81.01% chance of at least one five-loss run under the independent, constant-50% model.
Do not confuse two probabilities: qn measures one specified sequence. It does not measure the chance of seeing at least one n-loss run somewhere inside 100 trades. A larger sample contains many overlapping opportunities for a streak, so an exact run calculation or simulation is required.
Exact Baseline Probabilities Over 100 Trades
| Historical win rate | Loss rate | At least one 3-loss run | At least one 5-loss run | At least one 8-loss run | At least one 10-loss run |
|---|---|---|---|---|---|
| 40% | 60% | ~100.00% | 97.58% | 48.97% | 20.49% |
| 50% | 50% | 99.97% | 81.01% | 17.02% | 4.41% |
| 60% | 40% | 98.80% | 45.91% | 3.63% | 0.58% |
Methodology: values are computed by tracking the probability of ending each trade with zero through n minus one consecutive losses and subtracting the surviving no-run probability from one. Assumptions are independent trades, a constant win rate, exactly 100 trades, and binary win/loss outcomes. Real strategies may contain break-even trades, clustered signals, serial dependence, regime changes, and changing execution quality, so this is a baseline—not a forecast.
Also Read: Moving Average
Does a Losing Streak Mean the Next Trade Is More Likely to Win?
No—not merely because the previous trades lost. Under an independent-outcome model, the next trade retains the same probability. Believing that a win is “due” is the gambler’s fallacy. In real trading, outcomes may not be independent because market regimes and related setups can cluster, but that possibility requires evidence; it does not justify increasing size to recover losses.
Research on judgment and trading behavior documents that people can react to recent sequences in biased ways. Rabin and Vayanos model the gambler’s and hot-hand fallacies, while Ben-David, Birru, and Prokopenya studied how retail forex traders changed risk-taking after prior performance. These studies do not supply a universal rule for an individual strategy, but they support using written risk limits rather than intuition after a streak.
A win is not due: Previous losses do not make the next independent trade more likely to win. Real trading outcomes may cluster because of market regimes or related setups, but that possibility requires evidence. It does not justify doubling quantity or increasing risk to recover the drawdown.
Also Read: Double Top
How Much Drawdown Can Consecutive Losses Create?
When a fixed percentage of current equity is risked on each trade and every trade loses exactly that amount, the balance compounds downward. The drawdown after n losses is one minus the remaining-equity factor. Actual losses can be worse because of charges, slippage, gaps, liquidity, or rule violations.
Balance after n losses = Starting equity × (1 − risk fraction)n
Drawdown after n losses = 1 − (1 − risk fraction)n
| Risk per trade | After 3 losses | After 5 losses | After 8 losses | After 10 losses |
|---|---|---|---|---|
| 0.50% | 1.49% | 2.48% | 3.93% | 4.89% |
| 1.00% | 2.97% | 4.90% | 7.73% | 9.56% |
| 2.00% | 5.88% | 9.61% | 14.92% | 18.29% |
| 5.00% | 14.26% | 22.62% | 33.66% | 40.13% |
Illustrative starting equity: ₹1,00,000
Eight exact losses at 1% risk → Balance ≈ ₹92,274
Drawdown ≈ 7.73% → Required recovery ≈ 8.37%
At 2% risk → Drawdown ≈ 14.92% → Required recovery ≈ 17.54%
The example assumes risk is recalculated from current equity and excludes charges, slippage, gaps, taxes, deposits, and withdrawals.
Required recovery gain = Drawdown ÷ (1 − Drawdown)
At 2% risk per trade, the same eight-loss sequence leaves about ₹85,076, a 14.92% drawdown requiring approximately 17.54% to recover. At 5% risk, eight losses produce a 33.66% drawdown and require about 50.73% recovery. These figures illustrate why risk size matters more than finding a comforting streak length.
Also Read: Trendline
When Are Consecutive Losses Normal Variance?
A streak is more consistent with normal variance when the trades follow the same written setup, position sizes and exits; actual losses stay near planned losses; the sequence is plausible within a sufficiently large historical or simulated distribution; and broader strategy metrics have not deteriorated materially. “Plausible” does not mean harmless, and a backtest does not guarantee future behavior.
A positive-expectancy strategy can still lose repeatedly because expectancy describes an average across a sample, not the order of outcomes. A low-win-rate strategy may naturally experience longer losing runs than a high-win-rate strategy. That is why the observed streak must be compared with the defined strategy, not with another trader’s preferred limit.
Also Read: Positional Trading
When Does the Streak Point to a Process Problem?
Treat the streak as a process warning when one or more losses came from unplanned entries, late chasing, increased size, moved stops, ignored exits, correlated positions, repeated trading after a session limit, or omitted costs. In that case, probability calculations are secondary: the live process no longer matches the data used to justify the strategy.
| Evidence | Likely interpretation | Immediate response |
|---|---|---|
| Rules followed; losses near planned R | Possible normal variance | Continue only within existing limits and keep monitoring. |
| Rules broken or size increased | Execution/process failure | Pause the affected process; document violations before restarting. |
| Losses concentrated in one regime or setup | Possible regime or segmentation issue | Separate results by setup, volatility, trend, and holding period. |
| Actual loss repeatedly exceeds planned loss | Execution, gap, liquidity, or cost problem | Recalculate size and buffers; inspect order and fill records. |
| Streak far outside tested distribution | Model or edge may be unstable | Reduce exposure or pause; retest with recent, relevant data. |
| Mixed strategies in one sample | Measurement problem | Separate strategies before drawing a conclusion. |
Possible normal variance: Same tested setup, rules followed, losses close to planned R, and the run remains plausible within a relevant historical or simulated distribution.
Process failure: Unplanned entries, size escalation, moved stops, ignored exits, rapid re-entry, or missing cost records.
Possible strategy or regime problem: Clean execution but persistent deterioration in comparable trades, setup segments, liquidity, costs, or market conditions.
Also Read: Smart Money Concept
Should You Stop Trading After Three or Five Losses?
No universal loss count: A session stop is a behavioral circuit breaker; a strategy stop responds to evidence that assumptions or execution may have changed. Define each trigger, duration, and restart condition before the streak. Do not borrow another trader’s two-, three-, or five-loss rule without testing its purpose.
A useful session rule states the trigger, duration, and restart condition. For example: after a predefined session loss or a specified number of valid losses, stop new orders for the session, reconcile every fill, and resume only after the next planned review. This is an illustrative template, not a recommended number. Avoid moving the trigger during the session.
Also Read: Short Selling Mistakes
Should Position Size Be Reduced After Consecutive Losses?
Reducing size can lower further account damage and emotional pressure, but it should follow a written rule rather than fear. Decide the trigger, reduced size, minimum evidence for resumption, and maximum total drawdown in advance. If the strategy remains valid, arbitrary size changes can distort the very sample being evaluated; if execution has failed, continued trading at any size may be the wrong first step.
Never use a martingale-style response that increases risk simply because losses occurred. A future win is not guaranteed, and the required position can grow faster than available capital or margin. If the purpose is diagnosis, preserve clear records; if the purpose is capital protection, exposure may need to fall while the diagnosis is performed.
Also Read: Breakout
A Five Step Consecutive Loss Audit
- Record the streak without calling it bad luck or proof of failure.
- Reconcile net P&L, planned R, realized R, charges, and fills.
- Mark each trade valid or invalid against pre-existing rules.
- Compare the same setup, timeframe, regime, and realistic costs.
- Choose one documented response: continue, reduce, pause and retest, or retire.
Also Read: Morning Star & Evening Star
A Worked Eight Loss Reset
Assume an illustrative ₹1,00,000 account, a tested setup with a 50% historical win rate, and 1% risk recalculated from current equity. Eight valid -1R losses leave approximately ₹92,274 before costs. Under the simplified independent model, at least one eight-loss run within 100 trades has an estimated probability of 17.02%. The sequence is uncomfortable but not impossible.
The trader should not conclude that the ninth trade must win. The audit instead asks: Were all eight setups valid? Did actual loss remain close to -1R? Were trades clustered in the same sector or market regime? Did spreads, slippage, or charges change? Does the recent sample contain enough comparable trades to evaluate drift?
If execution was clean and the sequence remains within the strategy’s tested distribution, the written plan may allow continuation. If three trades violated rules, the live results do not test the strategy fairly. If all losses occurred after a regime shift and recent comparable trades show deteriorating expectancy, a pause and retest may be justified. The streak length initiates the review; evidence chooses the response.
How to Restart Without Revenge Trading
A restart should remove the recovery target from the next trade. The next position must qualify independently under the normal setup, risk, and portfolio rules. Do not increase size to return to the old equity peak quickly, and do not lower setup standards because the account is below that peak.
- Reconcile all closed and open trades before placing a new order.
- Write one sentence explaining why the next setup is valid without mentioning recovery.
- Use the prewritten normal or reduced risk rule; do not improvise quantity.
- Check portfolio heat and correlated exposure, not only the new trade.
- Set the exit and maximum session risk before entry.
- Review process compliance after the trade, regardless of profit or loss.
Also Read: Chart Pattern
Common Mistakes During a Losing Streak
- Assuming a win is due because the previous trades lost.
- Changing strategy rules after every loss and destroying comparability.
- Increasing size to recover the drawdown faster.
- Treating every loss as evidence the strategy is broken.
- Treating every loss as normal variance without checking execution.
- Mixing different setups to calculate one misleading win rate.
- Ignoring clustered sector, direction, or event exposure.
- Comparing planned stop risk with gross P&L while omitting costs.
- Deleting valid losses from the journal to improve statistics.
- Restarting because the trader feels calm rather than because the checklist is complete.
Also Read: Momentum
When the Probability Model Does Not Work Well
The simple model assumes independent trades and a stable loss probability. Those assumptions can fail when multiple positions depend on one market move, entries come from the same sector, a strategy works only in certain regimes, volatility changes, the trader alters rules, or option payoffs are nonlinear. A backtest may also understate live streaks through overfitting, survivorship bias, unavailable prices, or unrealistic execution.
Use the formula as a baseline, then test run lengths through resampling or simulation that preserves relevant features such as setup groups, regime labels, and portfolio overlap. Do not present simulated precision as certainty. The output is only as useful as the trade definitions and data quality behind it.
Also Read: Bollinger Band
Frequently Asked Questions
How many consecutive losses are normal in trading?
There is no universal number. The expected run depends on the strategy’s loss rate, number of trades, dependence between outcomes, and market regime. Compare the observed streak with the same strategy’s historical or simulated run distribution, then review execution and data quality before judging it normal or abnormal.
Can a profitable strategy have ten losses in a row?
Yes. Positive expectancy does not prevent long loss sequences, particularly when the win rate is low or many trades are taken. Under a simplified 50% independent model, the chance of at least one ten-loss run somewhere in 100 trades is about 4.41%. Real outcomes may cluster, so the model is a baseline only.
Should I double my risk after a losing trade?
No loss makes the next trade certain to win. Increasing size to recover losses can accelerate drawdown and may exceed capital or margin limits. Position-size changes should follow a tested, written rule based on risk capacity and evidence—not the belief that a reversal is due.
Is a trading pause the same as abandoning the strategy?
What should I record after each loss?
Also Read: Fibonacci Retracement
Methodology and Limitations
Probability values in this article were calculated for binary win/loss sequences using a dynamic program that tracks the current consecutive-loss state. Drawdown values assume a fixed percentage of current equity is lost on each trade, with no gains, charges, slippage, gaps, taxes, deposits, or withdrawals. Worked figures are hypothetical and were recalculated on October 15, 2026. They are not historical performance or a forecast.
NSE explains that stop-loss orders remain in the stop-loss book until the trigger is reached or surpassed, after which the order is released to the regular book; market orders execute at the best price obtainable. This supports treating the stop as a process tool, not a guaranteed fill price. SEBI investor material also emphasizes risk appetite, market, liquidity, and volatility risk. Links appear next to the relevant sources below.
Also Read: False Breakout
Final takeaway: A losing streak is a sequence, not a diagnosis. Probability shows whether the run is plausible, drawdown math shows whether the account can survive it, and a process audit shows whether the results belong to the strategy that was supposed to be traded. Let those three answers determine the response—not the urge to recover money quickly.
Disclaimer: This material is for educational purposes only and is not investment advice, a trading recommendation, or a guarantee of returns. Probability models and examples are simplified. Actual results may differ because of costs, taxes, liquidity, leverage, gaps, execution, and market conditions. Conduct your own research and consult a SEBI-registered professional where appropriate.