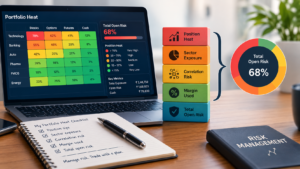
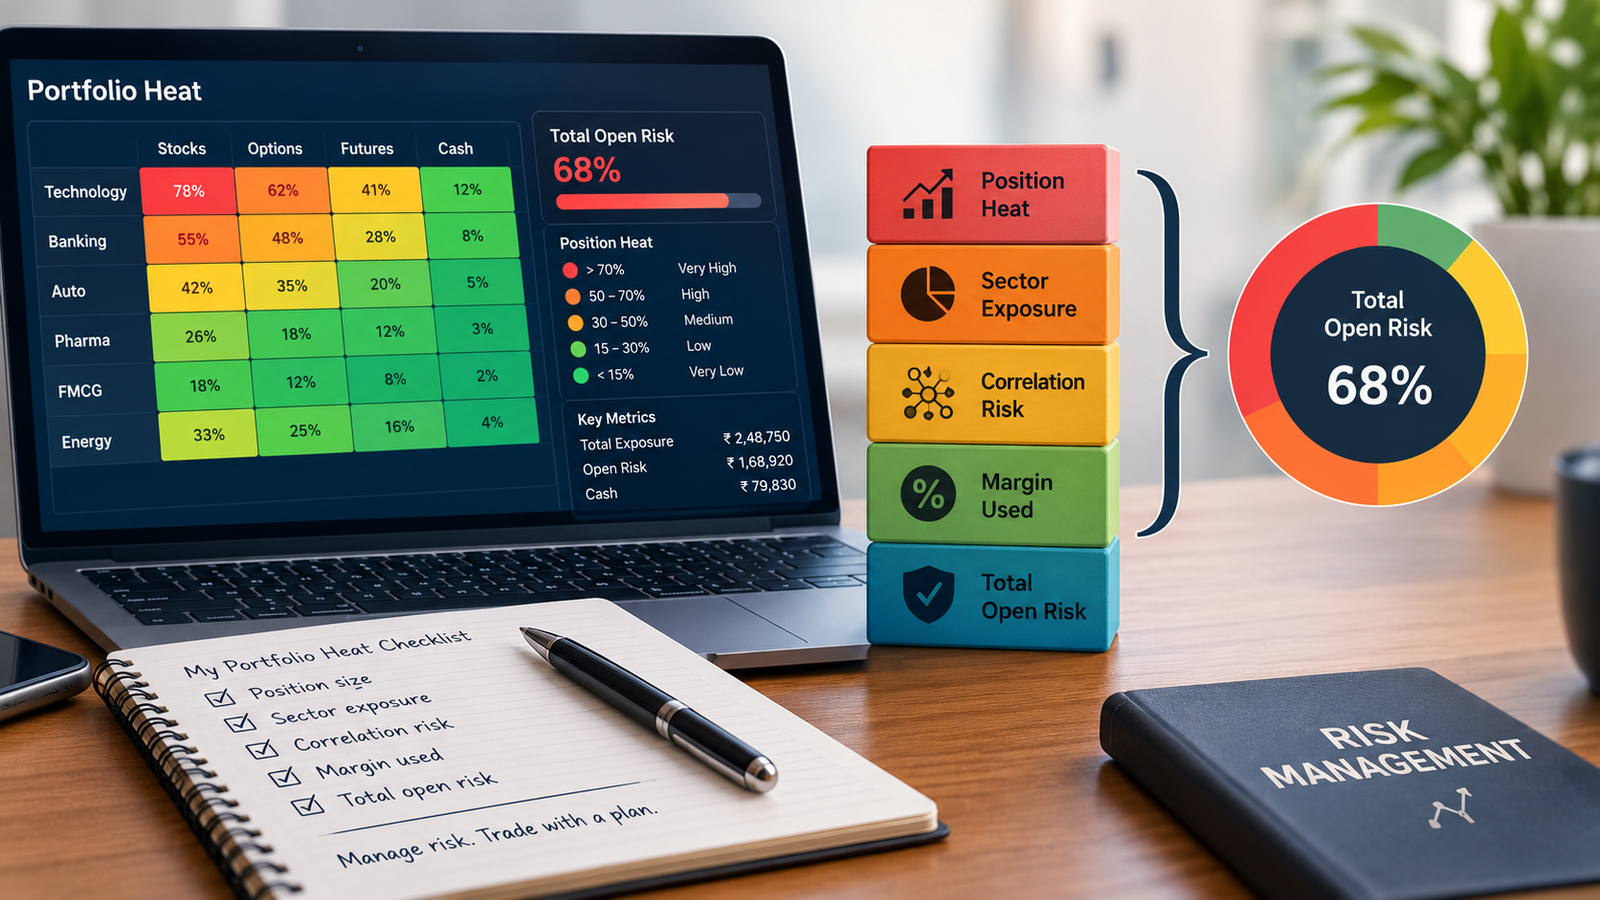
Quick answer: Portfolio heat in trading is the combined amount a trader plans to lose if all open positions reach their recorded exits, expressed in rupees or as a percentage of current account equity. It is a planning measure, not a guaranteed maximum loss. Calculate projected heat and review cluster and stress exposure before adding another trade.
A trader can follow a sensible risk rule on every individual trade and still build an unsafe portfolio. Five positions risking 0.5% each do not automatically represent five independent risks. They may all depend on the same sector, market direction, earnings theme, or breakout behavior. If those assumptions fail together, several stops can be reached in the same session—and actual losses can exceed the planned total.
That is why portfolio heat belongs on the pre-trade screen. It answers a simple operational question: “If the exits currently recorded for my open positions are reached, how much account equity is exposed?” A second question—“What could happen if exits fill worse than planned?”—requires a separate stress estimate. Keeping those questions separate makes the dashboard more honest.
Table of Contents
What Is Portfolio Heat in Trading?
Portfolio heat: The sum of non-negative planned risk across all open positions at a stated moment. Divide the rupee amount by current account equity to express it as a percentage. It measures stop-based open risk; it is not the same as capital invested, broker margin, drawdown, or guaranteed maximum loss.
Core portfolio heat formulas
Current portfolio heat (₹) = Sum of non-negative planned risk across all open positions
Current portfolio heat (%) = Current portfolio heat (₹) ÷ Current account equity × 100
For a long cash-equity position with a valid stop below the entry, planned risk can be estimated as (entry price − recorded stop price) × open quantity. For a short position, reverse the price difference. Add your chosen cost or execution buffer consistently if your policy includes it. When a stop moves above breakeven, do not enter negative heat; record stop-based heat as zero and track protected open profit separately. A gap can still turn that “protected” trade into a loss.
Also Read: Overtrading
What Portfolio Heat Measures—and What It Does Not
| Measure | What it answers | Important limitation |
|---|---|---|
| Initial committed heat | How much risk was accepted when the open trades were entered? | Useful for discipline reviews, but may not reflect updated stops. |
| Current heat | How much is exposed to the stops currently recorded? | Stops are instructions or triggers, not guaranteed fill prices. |
| Projected heat | What would total heat become after the proposed trade? | Assumes the proposed size and stop remain valid. |
| Cluster heat | How much planned risk shares one sector, theme, factor, direction, or event? | Clusters require judgment and can change with market conditions. |
| Stress heat | What loss might occur under a defined adverse-execution scenario? | Scenario-dependent; it is not a guaranteed worst case. |
Also Read: Technical Analysis
Heat Is Not Capital Invested, Margin, Drawdown, or Maximum Loss
These figures can move in different directions. A fully paid cash position may use substantial capital but have a small stop-based risk. A leveraged derivative may require less margin yet create larger nonlinear exposure. Drawdown measures a decline that has already occurred from an equity peak; heat estimates currently planned open risk. Maximum possible loss can be undefined or much larger than stop-based heat, especially in short options or during discontinuous price moves.
| Term | Plain-language meaning | Use |
|---|---|---|
| Capital invested | Cash or notional amount allocated to positions | Liquidity and allocation view |
| Broker margin | Collateral required under broker/exchange rules | Funding and margin-call view |
| Portfolio heat | Combined planned loss to recorded exits | Pre-trade risk budget |
| Drawdown | Decline from an equity peak | Realized account damage and recovery |
| Stress loss | Loss under a stated adverse scenario | Gap, slippage, correlation, and liquidity planning |
Also Read: Intraday Trading
Which Account Value Should Be the Denominator?
Use one clearly defined equity figure consistently. Current net liquidation value or current account equity is generally more responsive than starting capital because it tightens the percentage after losses and reflects account growth after gains. Broker balance labels vary, so document exactly which figure your journal uses and whether unrealized profit, blocked margin, and cash withdrawals are included. Consistency matters more than cosmetic precision.
If equity is ₹2,00,000 and current stop-based risk is ₹2,600, portfolio heat is 1.30%. If the account later declines to ₹1,80,000 while risk remains ₹2,600, heat becomes about 1.44%. The rupee risk did not change, but its burden on the smaller account increased.
Also Read: Moving Average
How to Calculate Portfolio Heat in Five Steps
- Record current account equity using the definition written in your trading plan.
- For every open position, record entry, current stop or exit level, remaining quantity, direction, sector or risk cluster, and any event exposure.
- Calculate non-negative stop-based risk for each position. Mark a position without a credible exit as “uncapped/unmeasured,” not zero.
- Add position risks for current heat; then add the proposed trade’s planned risk for projected heat.
- Compare projected total heat, cluster heat, and stress heat with your written limits before sending the order.
Also Read: Candlestick Trading
Worked Example: Four Open Positions and One Proposed Trade
Assume a hypothetical cash-equity account with current equity of ₹2,00,000. The symbols are deliberately omitted because the purpose is risk arithmetic, not a trade recommendation. Transaction costs and execution buffer are excluded for clarity.
| Position | Entry | Stop | Qty | Planned risk |
|---|---|---|---|---|
| A | ₹500 | ₹488 | 50 | ₹600 |
| B | ₹240 | ₹232 | 100 | ₹800 |
| C | ₹1,100 | ₹1,080 | 30 | ₹600 |
| D | ₹150 | ₹146 | 150 | ₹600 |
| Total current heat | ₹2,600 | |||
Current heat = ₹2,600 ÷ ₹2,00,000 × 100 = 1.30%
Now consider Position E: entry ₹320, stop ₹310, quantity 80. Its planned risk is ₹800. Adding it would produce projected heat of ₹3,400, or 1.70% of account equity. This does not say whether the trade is good. It says how the portfolio’s planned exposure would change if the trade were accepted.
After a proposed trade risking ₹800: Projected heat = ₹3,400 ÷ ₹2,00,000 × 100 = 1.70%
Interpretation: The proposed trade raises planned open risk from 1.30% to 1.70% of current equity. That number does not decide whether the setup is good. It shows how the portfolio risk budget changes and must still be checked against cluster concentration, execution quality, leverage, and the trader's written limits.
Also Read: Double Bottom
Why Projected Heat Matters More Than the New Trade Alone
Projected portfolio heat: Projected portfolio heat is current open risk plus the planned risk of a proposed position. It should be calculated before the order, not after it. A new trade may satisfy the per-trade risk rule yet still be rejected, reduced, or delayed if it breaches the total heat limit, raises one cluster excessively, or produces an unacceptable stress-loss estimate.
A per-trade rule prevents one position from becoming obviously oversized. Projected heat controls accumulation. This distinction is especially important when signals arrive together: a broad market breakout can produce several entries on the same day, but the apparent opportunities may be variations of one market bet.
Also Read: 10 Trading Mistakes
Cluster Heat: Five Symbols Can Still Be One Bet
Direct answer: Cluster heat adds the planned risk of positions that may respond to the same adverse driver—such as one sector, index direction, earnings theme, commodity input, strategy, or holding period. It reveals concentration that a symbol count misses. Correlation is not permanent, so clusters should be treated as practical risk labels and reviewed when market conditions change.
Suppose Positions A and B both belong to a financial-sector cluster. Their combined planned risk is ₹1,400, or 0.70% of the ₹2,00,000 account. If the proposed Position E is another financial name with ₹800 planned risk, that cluster would rise to ₹2,200, or 1.10%, even though total portfolio heat would be only 1.70%. The cluster view may therefore drive a different decision than the total alone.
| Possible cluster label | Question to ask |
|---|---|
| Sector | Could one sector-specific headline pressure several positions together? |
| Market direction | Are most trades effectively long beta or short beta? |
| Strategy | Are all positions using the same breakout, mean-reversion, or overnight logic? |
| Event | Do several positions cross the same election, policy, earnings, or macro event? |
| Liquidity | Could several positions become difficult to exit in the same stressed session? |
| Timeframe | Would multiple exits likely trigger during the same intraday or swing window? |
Also Read: Commodity Trading
Do Not Automatically Net Long and Short Positions
A long and a short position do not cancel merely because their notional values are similar. They may have different betas, gaps, liquidity, expirations, option convexity, or event sensitivity. If a hedge is part of a tested strategy, measure the combined scenario explicitly. Otherwise, keep gross stop-based heat visible and show any hedge benefit as a separate, documented stress assumption.
This is also why profit targets should not offset planned losses in the heat calculation. A target is a possible favorable outcome; heat is an exposure budget. Counting an unearned gain against an open loss understates risk precisely when the portfolio needs a conservative view.
Also Read: Double Top
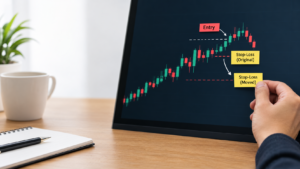
How Stop Changes Affect Current Heat
| Situation | Recommended heat treatment | Reason |
|---|---|---|
| Stop remains below long entry | Use remaining quantity × (entry − current stop) | Shows stop-based loss still open |
| Partial exit | Recalculate using remaining quantity | Original quantity overstates current risk |
| Stop moved to entry | Record zero stop-based heat; keep gap buffer separately | A fill at entry is not guaranteed |
| Stop moved above entry | Do not record negative heat; track protected profit separately | Negative heat would subsidize other risk |
| No credible stop or exit scenario | Mark unmeasured/uncapped and block automatic approval | Unknown risk is not zero |
| Option or nonlinear structure | Use strategy-level payoff and scenario loss | Simple price-distance arithmetic may mislead |
Also Read: Trading Victory
Stress Heat: Adjust for Gaps, Slippage, and Liquidity
Direct answer: Stress heat estimates loss under an explicit adverse-execution scenario rather than assuming every stop fills at its trigger price. Apply position-specific loss multipliers or scenario prices based on your own gap, slippage, liquidity, and event history. The output is a planning estimate—not a guaranteed maximum—and should sit beside, not replace, current and projected stop-based heat.
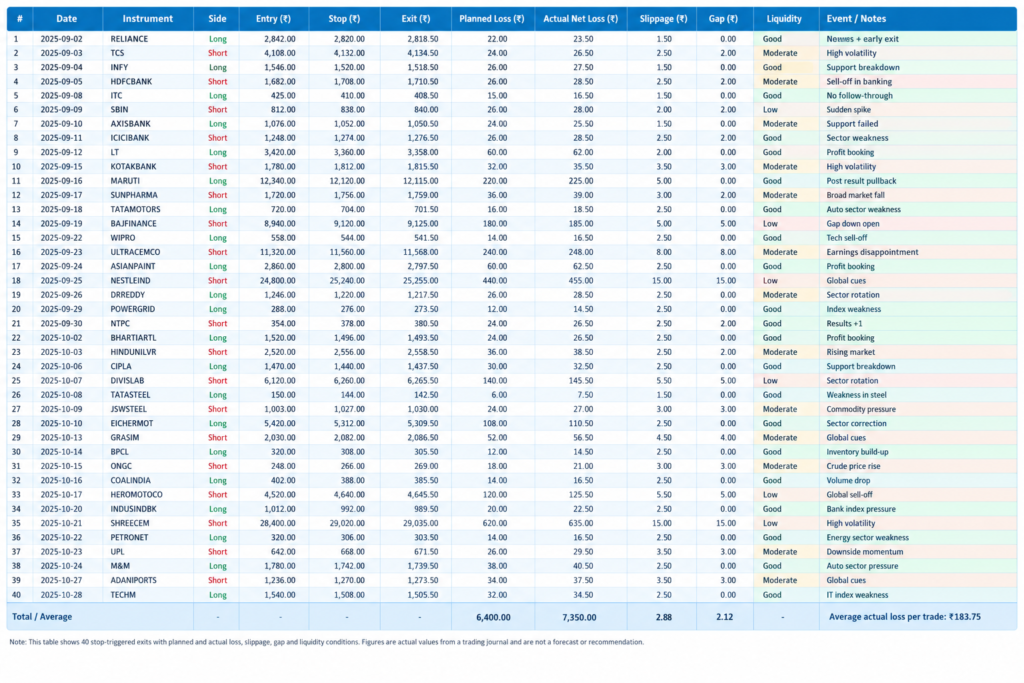
Regulatory and exchange material makes the limitation clear: volatility and liquidity can impair execution, a stop order activates only after its trigger is reached, and market orders execute at the best obtainable price. Therefore, a stop is essential process control but not a guaranteed loss cap. The stress model should be calibrated from the trader’s own records rather than borrowed from a generic table.
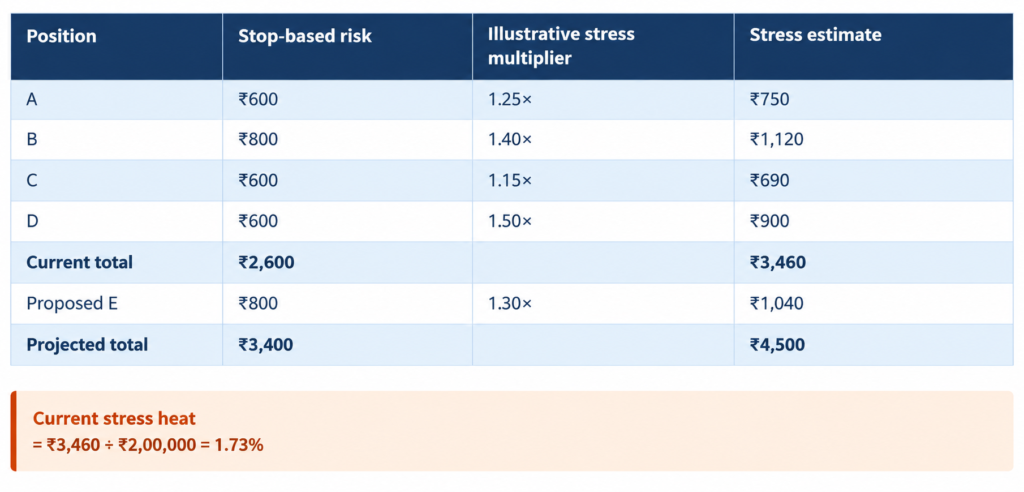
Projected stress heat after E = ₹4,500 ÷ ₹2,00,000 = 2.25%
Also Read: Trendline
Special Limits for Futures and Options
Simple stop-distance heat is often inadequate for derivatives. Futures add leverage and margin variability. Options can have nonlinear exposure, changing delta and volatility sensitivity, and expiration effects. A short option can carry loss far beyond the premium received. Multi-leg positions must be assessed at the strategy level so the same leg is not counted twice or a conditional hedge is assumed to be perfect.
For derivatives, keep three views: planned exit loss under normal execution, scenario loss under adverse price and volatility moves, and broker/exchange margin headroom. None is a substitute for the others. Do not publish a fixed universal buffer without testing it against the instruments and holding period actually traded.
Also Read: How to Choose The Best Timeframe for Trading
How to Set a Personal Portfolio Heat Limit
No universal safe percentage: A defensible heat limit depends on losing streaks, position overlap, tolerated drawdown, execution history, holding period, liquidity, overnight exposure, and leverage. Test separate limits for total, cluster, and stress heat against your own strategy records.
A lower limit may be appropriate when many trades share one driver, positions cross events overnight, the strategy trades thin instruments, or the trader’s historical slippage is unstable. A higher number is not automatically aggressive or sensible; it is merely a policy input until supported by records. The limit should also specify the response: reduce the proposed size, skip the setup, wait for other exposure to close, or reduce existing risk only when that action is allowed by the strategy.
Avoid reverse engineering a limit from the number of attractive signals today. The budget comes first. Opportunities compete for the budget; the budget does not expand because the watchlist is exciting.
Also Read: Smart Money Concept
A Practical Pre-Trade Decision Rule
| Check | Pass condition | If it fails |
|---|---|---|
| Per-trade risk | New position is within its tested risk limit | Reduce quantity or skip |
| Projected total heat | Current heat + new risk remains within written total limit | Reduce, delay, or skip |
| Projected cluster heat | Relevant cluster remains within its limit | Choose a less-overlapping setup or skip |
| Stress heat | Adverse scenario remains tolerable | Reduce size, avoid event exposure, or skip |
| Exit quality | Stop/exit is credible for instrument and liquidity | Do not treat risk as measured |
| Margin headroom | Stress does not threaten operational margin needs | Reduce leverage or exposure |
Also Read: Short Selling Mistake
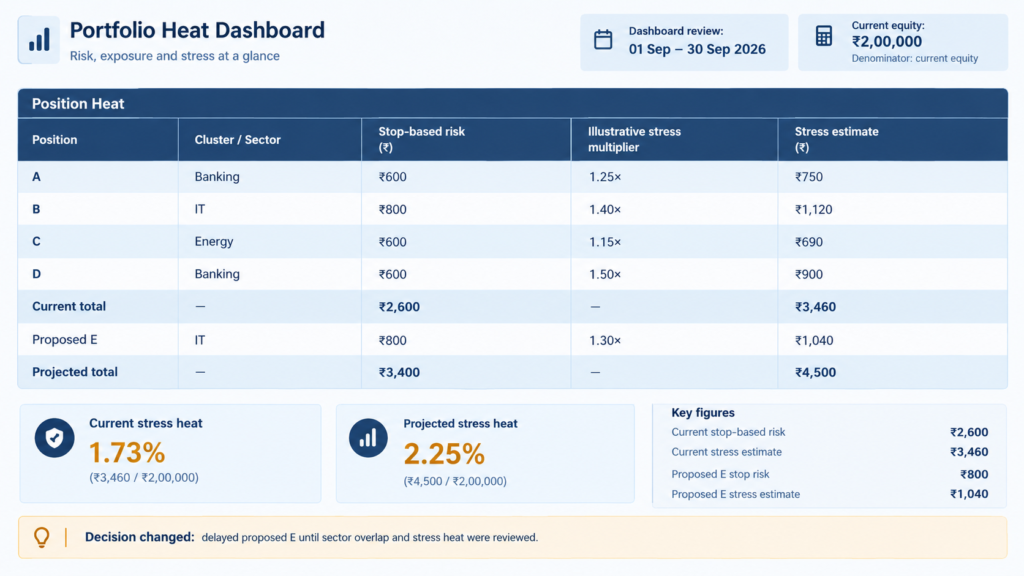
Portfolio Heat Dashboard: Minimum Fields
A dashboard should be simple enough to update after every fill, partial exit, stop change, deposit, or withdrawal. If it is not current, it is decoration. The minimum viable version can be a spreadsheet or journal table; automation is useful only after the definitions are stable.
| Field | Why it matters |
|---|---|
| Symbol and direction | Identifies the exposure |
| Entry, current stop, quantity | Calculates stop-based risk |
| Current equity | Creates a consistent percentage denominator |
| Sector/theme/strategy cluster | Reveals concentrated drivers |
| Event and overnight flag | Supports stress assumptions |
| Current and projected heat | Controls accumulation before entry |
| Normal and stress-loss estimate | Separates plan from adverse execution |
| Planned vs. actual net loss | Calibrates future stress assumptions |
Also Read: Chart Pattern
Common Portfolio Heat Mistakes
- Adding notional position values and calling the result risk.
- Calculating heat only after the new order has already filled.
- Treating an order trigger as a guaranteed execution price.
- Allowing profitable positions to create negative heat and subsidize new trades.
- Counting symbols while ignoring sector, strategy, direction, and event clusters.
- Netting long and short positions without a tested combined scenario.
- Calling a stopless position zero risk instead of unmeasured risk.
- Using starting capital forever while current equity has materially changed.
- Copying a popular heat percentage without testing the trader’s own loss sequence.
- Ignoring charges, slippage, taxes, and partial fills in the actual-loss review.
Also Read: Momentum
When This Method Can Fail
Portfolio heat is a model built on recorded exits. It becomes unreliable when stops are discretionary, quantities are stale, options are treated linearly, liquidity disappears, prices gap through exits, or correlation rises during stress. It can also create false precision if every rupee is calculated while the key assumptions remain untested. The remedy is not to abandon heat; it is to label uncertainty and maintain a parallel stress view.
The framework is also incomplete without realized outcomes. Compare planned risk with actual net loss, including charges and adverse execution. If actual losses repeatedly exceed planned loss by a wide margin, the dashboard’s assumptions—not merely the trader’s discipline—need revision.
Also Read: Morning Star & Evening Star
A 10-Minute Weekly Review
- Reconcile every open position, remaining quantity, and current stop with the broker record.
- Review the largest total-risk contributor and the largest cluster.
- Compare planned loss with actual net loss for trades closed that week.
- Update gap and slippage assumptions from new observations.
- Check whether profitable positions are incorrectly producing negative heat.
- Record one decision changed by the heat budget; if none changed for months, test whether the limits are meaningful.
Also Read: Bollinger Band
Frequently Asked Questions
Is 6% a safe portfolio heat limit?
Not universally. Any fixed percentage depends on trade frequency, stop distance, correlation, leverage, holding period, overnight risk, and the trader’s drawdown tolerance. Treat a heat cap as a policy to validate with the strategy’s own historical and forward-tracked results, not as a market law.
Does a stop above entry create negative portfolio heat?
Can a long position offset a short position?
Only if the hedge relationship is defined and tested under relevant scenarios. Similar notional values do not guarantee offsetting losses because beta, volatility, liquidity, expiration, and gap behavior can differ. Keep gross heat visible and report modeled hedge benefit separately.
Is portfolio heat the same as broker margin?
No. Margin is an operational collateral requirement. Portfolio heat is the planned loss to recorded exits. Both can change independently, and derivatives may create large scenario losses even when the displayed margin or normal stop-based heat appears manageable.
How often should portfolio heat be updated?
Update it after every entry, exit, partial fill, stop change, quantity change, material equity change, deposit, or withdrawal. Recalculate projected heat immediately before sending a new order. A stale heat number can be more dangerous than no number because it creates false confidence.
Should charges and slippage be included?
Use a documented convention. A practical dashboard may show clean stop-distance risk plus a separate execution-and-cost buffer. The performance review should compare planned risk with actual net loss after charges. Consistency allows the trader to improve the buffer from original records.
Also Read: Golden Crossover
Final Perspective
Portfolio heat does not decide which stock will rise. It decides how much damage a group of open ideas is allowed to cause if the market disagrees. The most useful version is not a single percentage. It is a small decision system: current heat, projected heat, cluster heat, and stress heat—updated before risk is added and reviewed after the outcome is known.
Start with transparent arithmetic. Then improve the assumptions using your own executions. That sequence keeps the framework realistic, auditable, and more valuable than a borrowed “safe” percentage.
Disclaimer: This content is for education only and is not investment, trading, tax, or legal advice. Examples are hypothetical. Stop orders and risk models cannot guarantee execution price or prevent losses. Trading and derivatives involve substantial risk. Evaluate suitability, liquidity, leverage, and current broker, exchange, and regulatory requirements before acting.
Also Read: Fibonacci Retracement