

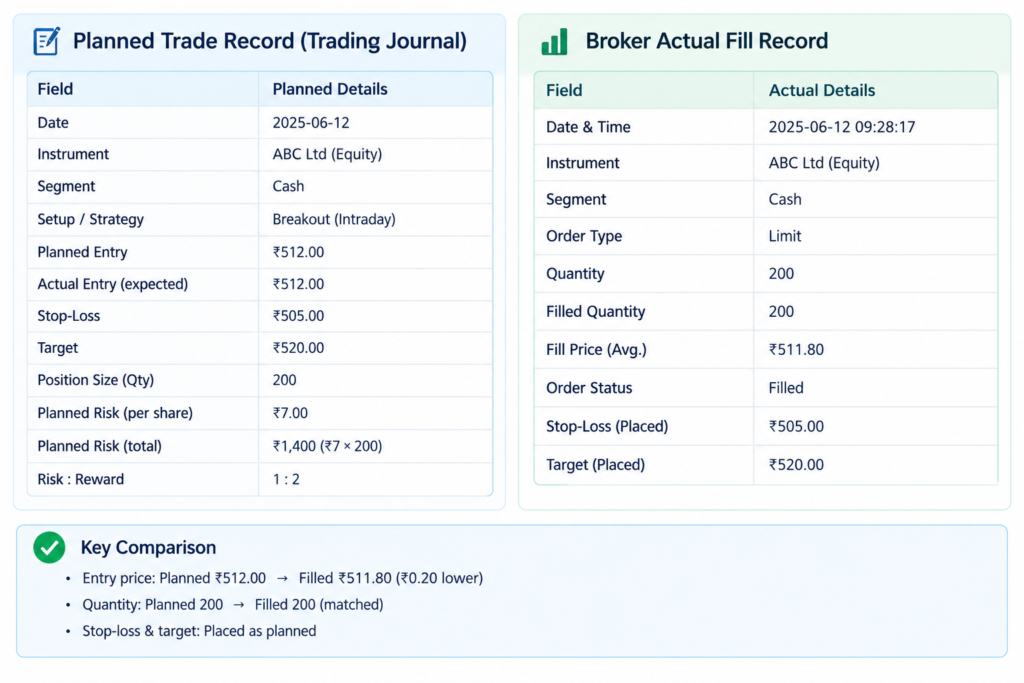
You planned to risk Rs. 500. The stop was triggered, yet the broker statement shows a Rs. 602 loss. The position-size formula was not necessarily wrong. The final result may include a different entry fill, a worse exit fill, a price gap, multiple partial fills, charges, or a decision to move the stop. Planned risk is a budget built from assumptions; actual loss is the measured outcome after execution. This guide shows how to reconcile the two, calculate risk deviation, identify the cause, and improve the next trade without pretending that a stop-loss guarantees an exact loss.
Quick answer: Planned risk is the loss estimated before a trade from the intended entry, stop, quantity, expected costs, and any execution buffer. Actual loss is the net amount lost after real fills and charges. Actual loss can be higher or lower because markets do not promise the planned prices, and the trader's execution or behavior can also change the original plan.
Table of Contents
Key takeaways
- A stop trigger is not the same as a guaranteed exit price.
- Track planned price risk and planned all-in risk as separate numbers.
- Use weighted average prices when an order fills in multiple trades.
- Measure the rupee gap, percentage deviation, and realized loss in R.
- Separate market-driven deviation from process and operational errors.
- Use your own comparable-trade history to estimate buffers; no universal buffer is safe for every instrument or market condition.
Also Read: Trend Reversal
What is planned risk in trading?
Planned risk: Planned risk in trading is the amount a trader intends to lose if the predefined exit occurs under stated assumptions. At minimum, it uses the planned entry, stop price, and quantity. A more realistic all-in plan also estimates entry and exit costs and an execution buffer. It remains an estimate, not a guaranteed maximum loss.
For a long cash-equity trade, the basic price-risk calculation is:
Planned price risk = (Planned entry - Planned stop) × Planned quantity
Planned all-in risk = Planned price risk + Estimated charges + Execution buffer
Keep both baselines in the journal. Price risk shows what the chart-based stop implies. All-in risk shows what the trade is expected to cost after normal friction. Calling both numbers simply ‘risk’ creates confusion later.
Also Read: Hedging
What is actual loss in trading?
Actual loss: Actual loss is the net realized loss based on the prices and quantities that actually executed, plus applicable charges and other costs included in the broker statement. It should be calculated from completed fills, not from the stop trigger, a chart marker, or the last traded price displayed when the order was sent.
Actual loss formula
Actual net loss = Gross price loss from actual fills + Actual charges and costs
Also Read: Nifty Expiry
Does a stop-loss guarantee the planned loss?
No. On NSE, a stop-loss order remains inactive until its trigger condition is met; once triggered, it is released to the regular order book. A market order seeks the best available price, while a limit order controls price but may remain unfilled. Rapid movement, low liquidity, wider spreads, or a gap can therefore make the final loss differ from the plan.
The NSE equity-market trading-system page explains the trigger process, order matching, price-time priority, and the possibility of partial matching. The SEBI Combined Risk Disclosure Document warns that risk-reducing orders may fail to limit losses during rapid market movement and that lower liquidity can lead to partial execution, a worse price, or no execution. Sources verified October 15, 2026.
Important: A stop-loss does not guarantee the planned loss. A trigger activates or releases the order, but the final execution still depends on the order type, available prices, liquidity, market movement, price controls, and whether the order fills completely.
Also Read: Candlestick
Planned risk and actual loss are different measurements
| Measurement | When calculated | Inputs | What it answers |
|---|---|---|---|
| Planned price risk | Before entry | Planned entry, stop, quantity | What is the chart-based loss if the assumed prices execute? |
| Planned all-in risk | Before entry | Price risk, estimated charges, execution buffer | What loss is budgeted under the planning assumptions? |
| Actual net loss | After exit | Actual weighted fills and actual charges | What amount was ultimately lost? |
| Risk deviation | After exit | Actual net loss minus planned all-in risk | How far did execution and behavior move the outcome away from the budget? |
Also Read: Sector Rotation
How to calculate planned risk versus actual loss
Use one definition consistently across the journal. The following framework treats loss as a positive magnitude; the broker statement may display the same result as a negative P&L.
Post-trade measurement
Risk deviation in rupees = Actual net loss - Planned all-in risk
Risk deviation % = (Risk deviation ÷ Planned all-in risk) × 100
Realized loss in R = Actual net loss ÷ Planned all-in risk
A positive deviation means the actual loss exceeded the budget. A negative deviation means the loss was smaller. A result of 1.10R means the realized loss was 110% of the planned all-in risk. It does not mean the strategy has an edge or that the next trade will behave similarly.
Also Read: Swing Trading
Worked example: a Rs. 500 chart risk becomes a Rs. 602 loss
The following cash-equity example is hypothetical. It uses invented prices solely to demonstrate the method; it is not a historical trade, stock recommendation, or claim about typical slippage.
| Input | Planned | Actual |
|---|---|---|
| Entry price | Rs. 250.00 | Rs. 250.20 weighted average |
| Stop / exit price | Rs. 245.00 stop | Rs. 244.60 weighted average exit |
| Quantity | 100 shares | 100 shares closed |
| Price loss per share | Rs. 5.00 | Rs. 5.60 |
| Gross price loss | Rs. 500 | Rs. 560 |
| Estimated / actual charges | Rs. 30 | Rs. 42 |
| Execution buffer | Rs. 20 | Already reflected in actual fills |
| All-in risk / net loss | Rs. 550 | Rs. 602 |
Illustrative calculation
Planned price risk = (Rs. 250 - Rs. 245) × 100 = Rs. 500
Planned all-in risk = Rs. 500 + Rs. 30 + Rs. 20 = Rs. 550
Actual price loss = (Rs. 250.20 - Rs. 244.60) × 100 = Rs. 560
Actual net loss = Rs. 560 + Rs. 42 = Rs. 602
Risk deviation = Rs. 602 - Rs. 550 = Rs. 52, or 9.45%
Realized loss = Rs. 602 ÷ Rs. 550 = 1.095R
What the example shows: Compared with the Rs. 500 chart risk, the final Rs. 602 loss appears 20.4% higher. Compared with the more realistic Rs. 550 all-in plan, the deviation is Rs. 52, or 9.45%. Keeping both baselines separates price movement from estimated execution costs.
Also Read: Double Bottom
How do partial fills change actual loss?
Weighted average fill = Sum of (Fill price × Fill quantity) ÷ Total filled quantity
Example: [(40 × Rs. 244.80) + (60 × Rs. 244.40)] ÷ 100 = Rs. 244.56
Use the order book, trade book, contract note, and broker ledger to reconcile the final number. Screenshots can help during review, but downloadable records are stronger evidence.
Also Read: Trading Mistakes
Why can actual loss exceed planned risk?
Actual loss can exceed planned risk because the market, the order, and the trader can all break the assumptions used before entry. Common causes include entry or exit slippage, overnight gaps, wide spreads, partial fills, charges, order rejection, delayed action, a moved stop, or a larger quantity than the plan allowed.
| Cause | What changes | Evidence to review | Control level | ||||||||||||||||||||||
|---|---|---|---|---|---|---|---|---|---|---|---|---|---|---|---|---|---|---|---|---|---|---|---|---|---|
| Entry slippage | Actual entry is worse than planned | Entry fills and order time | Partly controllable | ||||||||||||||||||||||
| Exit slippage | Exit occurs beyond the assumed stop | Exit fills and market depth | Partly controllable | ||||||||||||||||||||||
| Overnight or event gap | Price jumps across the stop | Previous close, next available trades, event calendar | Not fully controllable | ||||||||||||||||||||||
| Wide spread / low liquidity | Executable price differs from the chart's last price | Bid-ask spread, depth, volume | Often avoidable by selection and size | ||||||||||||||||||||||
| Partial fills | One order executes at several prices or not in full | Trade-book fill records | Market dependent | ||||||||||||||||||||||
| Charges and taxes | Net loss exceeds price loss | Contract note and ledger | Estimable, not removable | ||||||||||||||||||||||
| Order rejection or failure | Protective exit is not active or accepted | Order status and rejection message | Process / operational | ||||||||||||||||||||||
| Stop moved or canceled | Loss budget changes after entry | Order-modification history | Behavioral | ||||||||||||||||||||||
| Field | Why it matters |
|---|---|
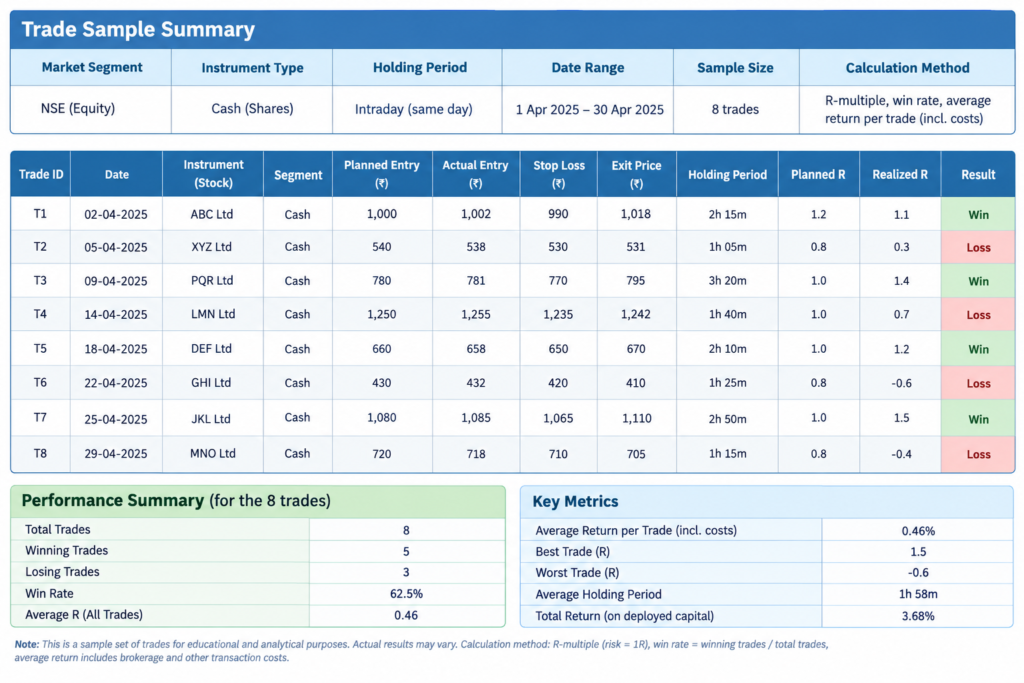
| Trade ID and date | Connects the journal to broker records. |
| Instrument and segment | Separates cash, futures, and options behavior. |
| Planned entry / actual weighted entry | Measures entry deviation. |
| Planned stop / actual weighted exit | Measures exit deviation. |
| Planned / actual quantity | Identifies exposure errors. |
| Planned price risk | Preserves the chart-based R baseline. |
| Estimated costs and buffer | Creates the all-in planning baseline. |
| Actual charges | Reconciles net broker P&L. |
| Risk deviation Rs. and % | Shows the size of the planning-execution gap. |
| Realized loss in R | Makes losses comparable across account sizes. |
| Cause tags | Separates gap, liquidity, spread, slippage, order, and behavior. |
| Evidence link | Points to the contract note, order log, or screenshot. |
Also Read: Top & Bottom Signal
How much slippage buffer should a trader use?
There is no universal slippage buffer for Indian stocks, futures, or options. A defensible estimate comes from the trader’s own comparable fills, separated by instrument, liquidity, order size, time of day, and market condition. A small sample can be misleading, and a normal-period average will not cap losses during a gap or disorderly market.
Start recording immediately. When enough comparable observations exist to show a stable pattern, examine the median, the worse tail, and the conditions behind outliers. Do not convert one extreme event into a permanent rule without considering how often it occurs and whether the trade should have been taken at all.
Also Read: Smart Money Concept
Ways to reduce avoidable risk deviation
- Round position size down after including realistic cost and execution assumptions.
- Check spread, depth, recent volume, and likely market impact before entry.
- Understand the trade-off: a market-style exit prioritizes execution but not price; a limit exit controls price but may not execute.
- Confirm that the protective order is accepted, active, and correctly sized. Review broker-specific behavior and product availability.
- Reduce or avoid exposure around known events when the strategy has no tested reason to hold through them.
- Do not widen or cancel a stop merely because the trade is losing. Any exception should be defined before entry and tested independently.
- Review recurring deviations by instrument and time window instead of applying one account-wide buffer.
In the equity-derivatives segment, NSE’s Limit Price Protection rules can reject limit prices outside the prevailing range, including an SL-limit order when it is released after triggering. Exchange controls and broker interfaces can change, so verify current order behavior rather than relying on an old screenshot or tutorial. See the NSE Limit Price Protection FAQ. Verified October 15, 2026.
Also Read: Backtesting
When this method can mislead you
- Mixed strategies: combining liquid intraday trades with overnight small-cap trades hides different execution behavior.
- Options: premium, changing Greeks, lot size, spread, and rapid decay require more context than a simple share-price formula.
- Open positions: unrealized loss is not a final actual loss.
- Inconsistent cost treatment: comparing gross loss in one trade with net loss in another corrupts the series.
- Survivorship and selection bias: reviewing only the worst fills exaggerates the typical deviation; reviewing only clean fills hides risk.
- Structural change: exchange controls, broker systems, tick sizes, liquidity, or strategy execution can change over time.
- False certainty: a historical buffer reduces planning error under similar conditions but cannot cap a future gap.
Also Read: Momentum
Frequently asked questions
Can actual loss be smaller than planned risk?
Yes. The position may exit before the stop, receive favorable execution, fill a smaller quantity, or incur lower charges than estimated. Record negative as well as positive deviation; otherwise the review will be biased.
Is the stop trigger the same as the execution price?
No. A trigger activates or releases the order under the applicable order design. Execution then depends on the order book, price-time priority, available quantity, price controls, and the order type.
Should trading charges be counted in actual loss?
Yes, if the goal is to reconcile the net effect on the account. Use the contract note or ledger and apply the same cost definition to every comparable trade.
Is a fixed 10% slippage buffer enough?
No universal percentage is reliable. A buffer should come from relevant execution records and still cannot guarantee protection from gaps, halts, rejected orders, or exceptional liquidity conditions.
What is the difference between slippage and a gap?
Slippage is the difference between an expected price and the actual fill. A gap is a jump between traded price areas with little or no trading in between. A gap can cause large slippage when an exit becomes executable at the next available price.
Does a risk deviation above 1R mean the strategy is bad?
Not by itself. It shows the loss exceeded the selected planning baseline. Diagnose the cause and frequency across comparable trades before changing the strategy.
Final takeaway: A position-size calculation is a plan, not a promise from the market. Record the assumptions before entry, reconstruct the actual weighted fills, include real costs, and measure the deviation consistently. The useful question is not only whether the stop was hit, but which assumption changed and whether the cause was market-driven or avoidable.
Also Read: Morning Star & Evening Star
Sources and further reading
National Stock Exchange of India – Equity Market Trading System – Order books, trigger conditions, order types, price-time priority, and partial matching. Page states updated February 28, 2024; verified October 15, 2026.
National Stock Exchange of India – Limit Price Protection FAQ – Limit-price validation and treatment of SL-limit orders in equity derivatives. Verified October 15, 2026.
SEBI – Combined Risk Disclosure Document for Clients – Volatility, liquidity, spreads, market and limit orders, stop-loss limitations, news, and system risk. Verified October 15, 2026.
SEBI Investor – Key Risks in Investing in the Securities Market – Investor education on liquidity, volatility, market, business, and currency risk. Verified October 15, 2026.
Also Read: Bollinger Band
Financial disclaimer
This material is for educational purposes only and is not investment advice, a recommendation, or an assurance of returns. Securities-market investments and trading involve market, liquidity, execution, operational, and capital-loss risk. A stop-loss order does not guarantee an exact loss. Conduct your own research and consult a SEBI-registered professional when appropriate.
Also Read: Fibonacci Retracement