

A trade can finish with a profit and still reveal a weak entry. It can finish with a loss even though price later moved strongly in the intended direction. The final profit or loss shows where the trade ended; maximum adverse excursion and maximum favorable excursion show part of the path it took to get there.
This guide explains how to calculate both metrics, normalize them in percentage and R terms, and use a group of comparable closed trades to review entries, stops, and exits. It does not provide a trading signal, a universal stop distance, or a prediction of the next trade.
Table of Contents
Quick Answer
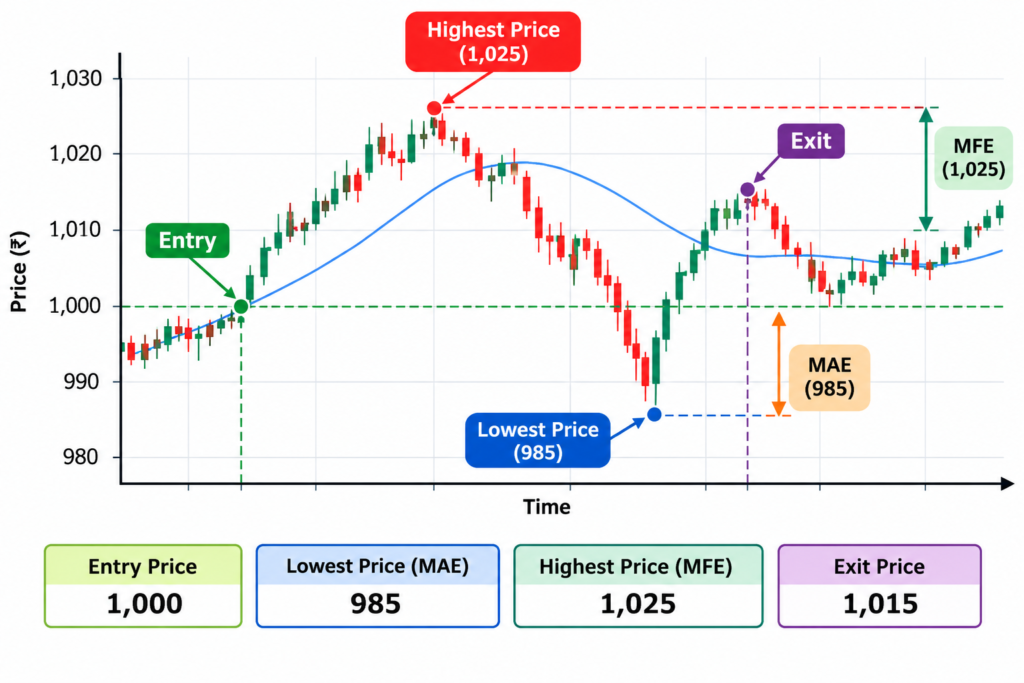
Maximum adverse excursion in trading is the largest unrealized move against a position between the actual entry and final exit. Maximum favorable excursion is the largest unrealized move in the position's favor during the same window. Together, they describe the trade's path, but they should inform stop and entry reviews only after comparable trades are grouped and tested outside the original sample.
Also Read: Triangle Chart Pattern
What Is Maximum Adverse Excursion in Trading?
Maximum adverse excursion (MAE) measures the greatest unrealized loss a position experienced while it was open. For a long trade, it is based on the lowest price reached after the entry fill and before the final exit fill. For a short trade, it is based on the highest price reached during that window.
MAE answers a precise historical question: “How far did this trade move against me before I closed it?” It does not answer whether the move was acceptable, whether the entry was valid, or whether the same distance will contain risk next time. Those conclusions require context and a sample of comparable trades.
Also Read: Swing Trading
What Is Maximum Favorable Excursion in Trading?
Maximum favorable excursion (MFE) measures the greatest unrealized profit reached while the position was open. For a long trade, it uses the highest price between entry and exit. For a short trade, it uses the lowest price.
MFE answers another historical question: “How far did the trade move in my favor before I exited?” Comparing MFE with the realized outcome can highlight profit giveback, early exits, or an exit rule that behaves differently across market conditions. A high MFE does not prove the trader should have captured the entire move because the maximum is visible only after the trade.
Also Read: Hedging
How Are MAE and MFE Different?
| Metric | Measures | For a long trade | Useful review question |
|---|---|---|---|
| MAE | Largest unrealized adverse move | Entry minus lowest price | Was the stop inside normal movement for this setup? |
| MFE | Largest unrealized favorable move | Highest price minus entry | How much opportunity appeared before exit? |
| Realized result | Outcome at the actual exit | Exit minus entry | What did the trading plan actually capture? |
Also Read: Support & Resistance
How Do You Calculate MAE and MFE?
Formula for a Long Trade
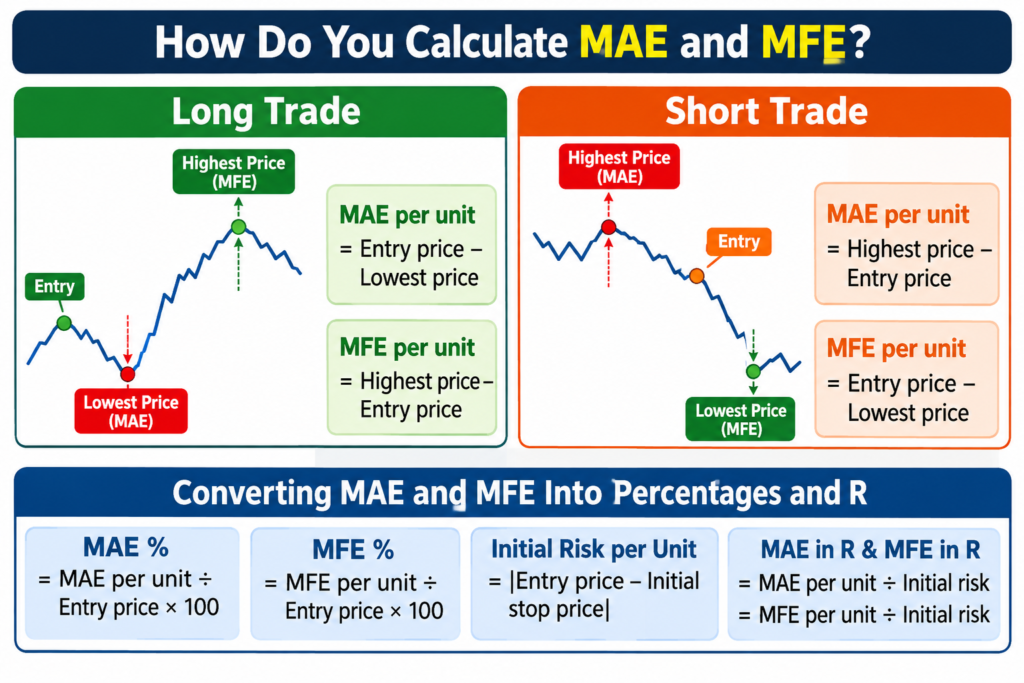
MAE per unit = Entry price - Lowest price while the trade is open
MFE per unit = Highest price while the trade is open - Entry price
If price never moves against the entry, record adverse excursion as zero rather than a negative value. Apply the same zero floor to MFE when price never moves in favor of the trade.
Formula for a Short Trade
MAE per unit = Highest price while the trade is open - Entry price
MFE per unit = Entry price - Lowest price while the trade is open
Converting MAE and MFE Into Percentages and R
MAE % = MAE per unit ÷ Entry price × 100
MFE % = MFE per unit ÷ Entry price × 100
Initial risk per unit = Absolute value of Entry price - Initial stop price
MAE in R = MAE per unit ÷ Initial risk per unit
MFE in R = MFE per unit ÷ Initial risk per unit
Also Read: Nifty Expiry
Worked Example: Did the Stop Need More Room?
Consider a hypothetical long cash-equity trade. The numbers are illustrative, exclude brokerage, taxes, slippage, and other charges, and are not a recommendation.
| Input | Value |
|---|---|
| Entry price | ₹500 |
| Initial stop | ₹490 |
| Initial risk per share | ₹10 |
| Quantity | 100 shares |
| Planned rupee risk | ₹1,000 |
| Lowest price while open | ₹493 |
| Highest price while open | ₹530 |
| Exit price | ₹518 |
MAE = ₹500 - ₹493 = ₹7 per share = 1.4% of entry = 0.7R
MFE = ₹530 - ₹500 = ₹30 per share = 6.0% of entry = 3.0R
Gross realized move = ₹518 - ₹500 = ₹18 per share = 3.6% of entry = 1.8R
Profit giveback = ₹30 - ₹18 = ₹12 per share = 1.2R, or 40% of MFE
MFE capture ratio = ₹18 ÷ ₹30 × 100 = 60%
Hypothetical example before brokerage, taxes, slippage, and other charges. It is not a recommendation.
The original ₹490 stop was not touched, and the trade’s MAE was 0.7R. That does not prove a 0.7R stop is correct. One observation cannot show whether this movement was normal, whether a tighter stop would improve expectancy, or whether the entry was late. The calculation becomes useful only when repeated across comparable trades.
Before applying any stop distance, calculate position size from the intended rupee risk rather than increasing account risk to accommodate a wider stop. See the site’s position-sizing guide in the internal-link plan above.
Also Read: Candlestick Trading
Can MAE Tell You Whether Your Stop Is Too Tight?
MAE can provide evidence that a stop may be too tight when many valid eventual winners repeatedly move beyond that stop level before reaching their planned outcome. The evidence is not one stopped trade. It is a stable pattern among comparable trades that remains visible in a later or out-of-sample period.
Review Winning Trades Separately
Start with trades that followed the setup definition and eventually produced a favorable outcome under a consistent evaluation rule. Examine their MAE distribution. If a proposed stop would have removed a large share of those winners, the stop may be inside the setup’s normal adverse movement. Then review losing and stopped trades separately; widening a stop can preserve winners while also increasing the size of genuine losses.
Also Read: V
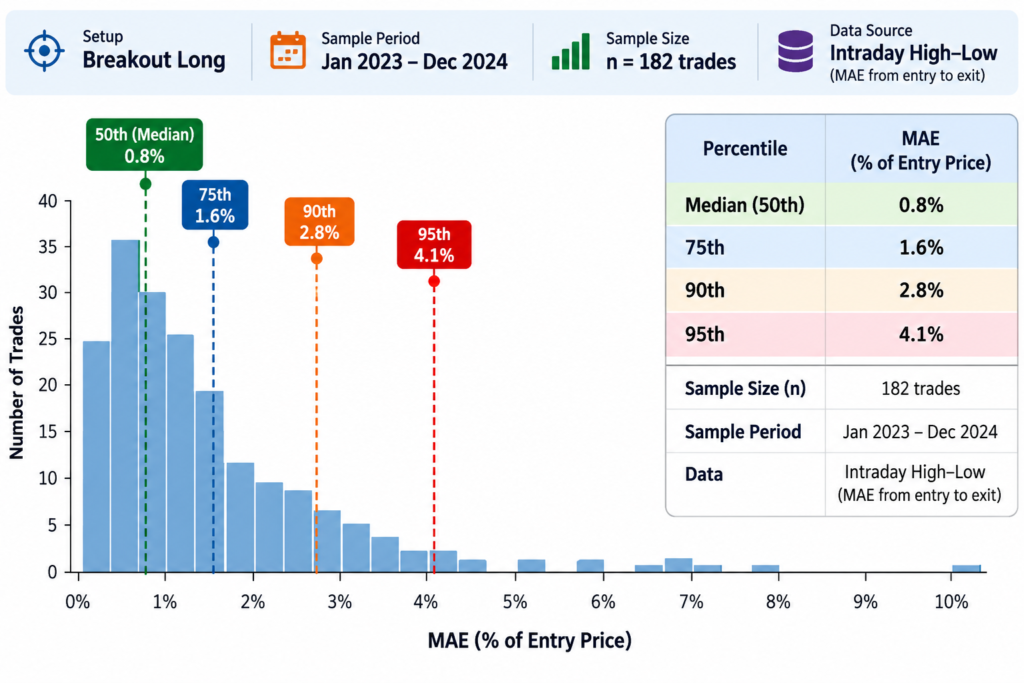
Use Percentiles Instead of One Average
An average can hide a long tail. Record the median and selected percentiles of winning-trade MAE, along with sample size. A percentile is descriptive, not a magic threshold. The chosen level still needs to fit the setup’s invalidation logic, position sizing, expected payoff, liquidity, and the trader’s maximum acceptable risk.
Validate the Stop Outside the Original Sample
If a trader selects a stop from a dataset and judges the same stop on that same dataset, the result is vulnerable to overfitting. Develop the rule on one period and test it on a later period, or use a clearly separated validation sample. A rule that looks precise in hindsight can fail when volatility, liquidity, or market structure changes.
Also Read: Double Bottom
Can MAE Reveal a Poor Entry?
MAE can flag an entry-timing problem when valid trades often suffer large adverse movement immediately after entry and then recover. That pattern may indicate an entry before confirmation, price chasing near a short-term extreme, or a normal setup retest that the entry rule does not handle well.
Also Read: Trading Mistakes
What Does MFE Say About Your Exit?
MFE helps describe the opportunity that appeared before the exit. It can expose repeated profit giveback or show that an exit consistently captures only a small part of favorable movement. It cannot tell the trader to sell at the historical maximum, which is unknowable in real time.
Profit Giveback
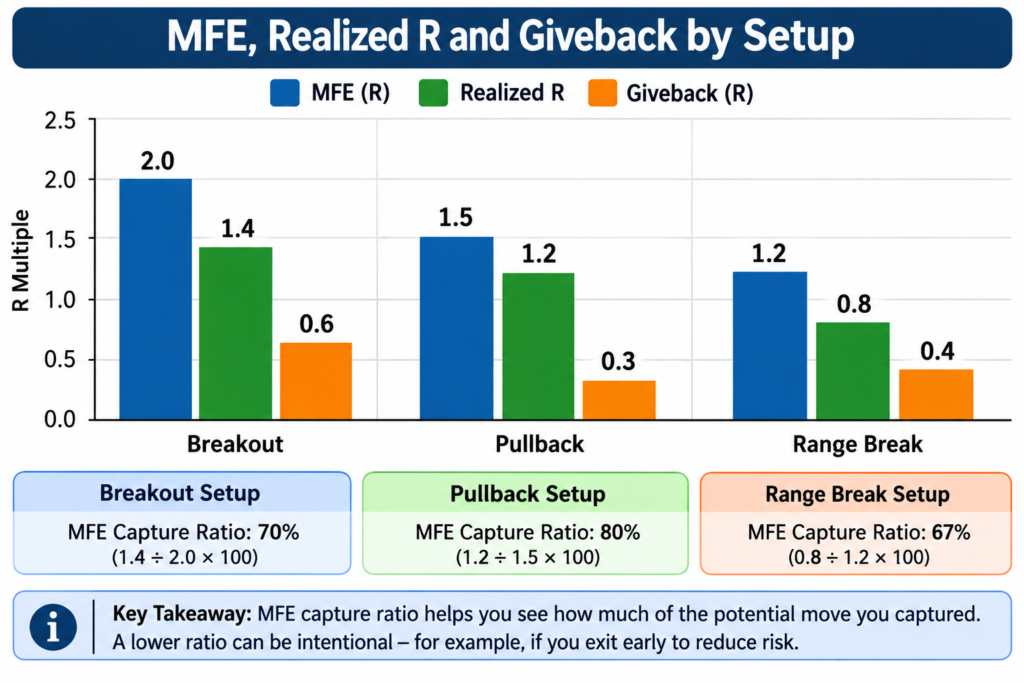
For a profitable long trade, profit giveback per unit can be written as MFE per unit minus the gross realized favorable move. Keep the sign convention consistent for shorts. Compare giveback only across trades measured on the same basis and separate planned trailing exits from discretionary exits.
MFE Capture Ratio
Profit giveback per unit = MFE per unit - Gross realized favorable move
MFE capture ratio = Gross realized favorable move ÷ MFE × 100
Use the capture ratio only when MFE is greater than zero and both values use a compatible scale. It is descriptive, not a universal performance score.
Also Read: Double Top
How Should You Build an MAE and MFE Journal?
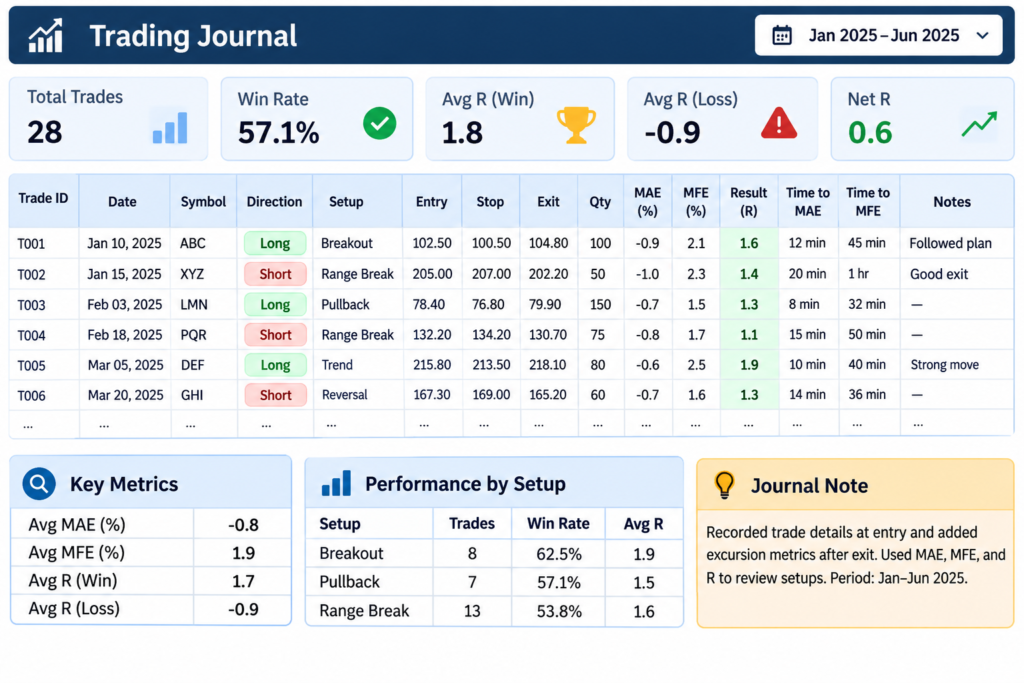
A useful journal connects path metrics with the original plan. Record the information at the time of the trade, then add excursion metrics after the position is closed. The site’s Trade Metrics tool can be linked from the phrase “record and review closed trades.”
Minimum Fields
| Field | Why it matters |
|---|---|
| Trade ID and dates | Prevents duplicate records and defines the evaluation window |
| Symbol, direction, and setup | Supports comparable groups |
| Actual entry, stop, quantity, and exit fills | Connects planned risk with realized execution |
| Highest and lowest price while open | Provides the inputs for MAE and MFE |
| MAE and MFE in price, %, and R | Supports more than one comparison scale |
| Realized gross and net result | Separates path from costs |
| Time to MAE and MFE | Adds timing context |
| Market, sector, and volatility context | Helps explain regime differences |
| Rule adherence and notes | Separates strategy behavior from execution errors |
- Trade ID, dates, symbol, direction, setup, and timeframe
- Actual entry, initial stop, quantity, and exit fills
- Highest and lowest prices while the position was open
- MAE and MFE in price, percentage, and R
- Realized gross and net result plus time to MAE and MFE
- Market context, rule adherence, and review notes
Data Cleaning Rules
- Use actual fill prices, not planned prices, for the entry and exit window.
- Use intraday high-low data at a resolution suitable for the strategy. Close-only data can understate excursions.
- Adjust historical prices for corporate actions when needed and document the data source.
- Treat partial entries and exits consistently. Do not mix lot-level and position-level records.
- Keep open trades separate from closed-trade analysis unless they are clearly marked.
- Review gaps, bad ticks, suspended trading, and illiquid bars before accepting an extreme value.
- State whether brokerage, taxes, slippage, and financing costs are included in realized results.
Also Read: Trendline
A Practical MAE and MFE Audit
| Step | Action | Decision supported |
|---|---|---|
| 1 | Define one setup, direction, timeframe, and measurement window. | Creates a comparable sample. |
| 2 | Verify fills, highs, lows, stops, and corporate-action adjustments. | Reduces data errors. |
| 3 | Calculate MAE, MFE, realized R, giveback, and time to excursion. | Describes each trade path. |
| 4 | Separate winners, planned losses, rule violations, and execution errors. | Avoids mixing different causes. |
| 5 | Inspect distributions and scatter plots, not just averages. | Shows clusters and tails. |
| 6 | Form one testable change to entry, stop, or exit. | Prevents multiple hindsight edits. |
| 7 | Recalculate position size and expected payoff after the change. | Keeps account risk controlled. |
| 8 | Validate on later data or through a forward test. | Tests robustness. |
| 9 | Monitor live results and define a review date. | Detects regime drift. |
Practical audit
- Define one setup, direction, timeframe, and measurement window.
- Verify fills, highs, lows, stops, and data adjustments.
- Calculate MAE, MFE, realized R, giveback, and time to excursion.
- Separate winners, planned losses, rule violations, and execution errors.
- Form one testable change and recalculate position size.
- Validate on later data or through a forward test.
Also Read: Smart Money Concept
Common MAE and MFE Mistakes
Treating one trade as proof. A single path can be noise.
Pooling unlike trades. Long and short trades, different setups, timeframes, and volatility regimes can have different excursion behavior.
Using future information. The final MFE is not visible at the time of exit.
Optimizing and evaluating on the same sample. This can make a stop look more reliable than it is.
Ignoring execution. A stop order is triggered at a threshold, but the obtainable fill can differ in a fast or illiquid market.
Using close-only data. The bar’s close may miss the highest or lowest price reached while the trade was open.
Assuming wider is safer. A wider stop increases loss per unit and may reduce position size or worsen payoff.
Changing the stop without recalculating size. Planned account risk can rise unintentionally.
Confusing planned risk with actual loss. Gaps, slippage, costs, and rule violations can make them different.
Also Read: Breakout
When Does This Method Not Work Well?
MAE and MFE become less reliable when data cannot reconstruct the trade window accurately. A bar can contain both its high and low without revealing which occurred first. This intrabar sequencing problem matters when a target and stop appear inside the same bar. Use finer data when the strategy requires it, but do not claim certainty the data does not provide.
Simple share-price formulas can also mislead for options and complex derivatives because premium behavior depends on more than the underlying price. Define whether the metric applies to the instrument, the underlying, or the complete strategy. Liquidity gaps, circuit limits, stale prices, and large spreads can further separate theoretical excursion from executable outcomes.
Most importantly, excursion statistics are historical descriptions. Market, liquidity, and volatility risks can change. They should be combined with setup invalidation, position sizing, drawdown limits, and current execution conditions.
Also Read: Momentum
Frequently Asked Questions
Is Lower MAE Always Better?
No. Lower MAE can reflect a precise entry, but it can also occur by chance or because the sample contains only favorable conditions. Judge MAE against setup quality, MFE, realized return, costs, and the number of comparable trades. A lower value is useful only if the underlying process remains valid and the improvement survives later testing.
Is Higher MFE Always Better?
No. Higher MFE shows that more unrealized opportunity appeared, not that it was realistically capturable. A trade may need time and risk to reach that point, and a rules-based exit may intentionally accept less upside to control reversals. Evaluate MFE with MAE, holding time, realized result, and the exit rule.
How Many Trades Do You Need?
There is no universal number. The required sample depends on how often the setup occurs and how variable its outcomes are. Report the sample size, avoid conclusions from a handful of trades, and keep collecting data until the pattern is stable enough to test on a separate period. More data cannot repair inconsistent definitions or poor records.
Can MAE Set a Stop-Loss Automatically?
No. MAE can show where adverse movement occurred in prior comparable trades, but a stop also needs a logical invalidation point, acceptable rupee risk, executable market conditions, and a positive overall payoff. Any candidate rule should be validated on later data and monitored after deployment.
Should MAE Include Brokerage and Slippage?
Calculate price excursion from the market path and report costs separately, then use net realized results when evaluating whether a rule is economically useful. Slippage belongs in the execution review because it can make the actual loss exceed the price-based plan. Document the convention and apply it consistently.
Also Read: Morning Star & Evening Star
Methodology and Limitations
This article uses standard trade-path definitions for MAE and MFE and applies them to a hypothetical cash-equity example. The framework assumes reliable entry and exit fills plus the highest and lowest prices reached while the position was open. It does not claim that an excursion percentile predicts the next trade or that a stop can be selected without strategy context.
Published examples should disclose the market, instrument, setup, timeframe, sample period, sample size, data resolution, cost treatment, and validation method. Original results should be reproducible from anonymized source data where practical. Historical analysis is vulnerable to survivorship bias, selection bias, look-ahead bias, data errors, regime change, and overfitting.
NSE explains that a market order executes at the best obtainable price and that a stop-loss order becomes active only when its threshold is reached or crossed. SEBI’s investor education material identifies market, liquidity, and volatility risk. These constraints are why a journal’s theoretical price path and the actual executed loss can differ.
Also Read: Bollinger Band
Key Takeaways
- MAE measures the largest unrealized adverse move; MFE measures the largest unrealized favorable move.
- Use the actual entry-to-exit window and normalize values consistently.
- Do not diagnose a stop from one trade or pool unlike setups.
- Validate any rule change outside the dataset used to create it.
- Recalculate position size whenever the stop distance changes.
Also Read: Golden Crossover
Final Perspective
Maximum adverse excursion in trading is most useful as an audit tool, not a stop-loss generator. It turns a vague complaint such as “my stop is always too tight” into a measurable question. MFE adds the other half of the path by showing how much favorable movement appeared before exit.
The practical edge comes from disciplined definitions and honest comparison. Record the original plan, preserve actual fills, group like trades, test one change at a time, and accept uncertainty. The result may be a wider stop, a later entry, a different exit, or no change at all. The purpose is not to force an answer; it is to make the decision traceable.
Also Read: Fibonacci Retracement
Sources and Further Reading
Fidelity Wealth-Lab Pro User Guide – Definitions and analysis views for MAE and MFE.
NSE Equity Market Trading System – Order-type mechanics, including market and stop-loss orders.
SEBI Investor Education – Key Risks in Trading Derivatives – Market, liquidity, and volatility risks.
Also Read: False Breakout