
Price Action Trading is one of the few trading approaches that can help you make decisions using the most important piece of market information: price itself.
Many beginners spend months jumping between indicators, strategies, and signals. Yet experienced traders often reach the same conclusion. The chart becomes much easier to read when you focus on price, market structure, and momentum instead of filling your screen with tools.
If you want a practical way to understand market behavior, price action is a great place to start.
Table of Contents
What Is Price Action Trading?
Traders analyze price action to understand how buyers and sellers interact. Instead of depending heavily on indicators, you study how buyers and sellers interact at important levels.
In simple terms, you watch:
- Market structure
- Support and resistance
- Candlestick behavior
- Momentum shifts
- Entry and exit opportunities
For example, if price repeatedly rejects a resistance area and forms a bearish pattern, sellers may be gaining control. On the other hand, strong bullish candles near support can signal growing buying pressure.
Price Action Trading is a trading method that uses price movement, market structure, and candlestick behavior to identify potential trading opportunities without relying heavily on lagging indicators.
Also Read: How to Use Stock Heatmaps
Why Many Traders Prefer Price Action
Price action keeps trading simple. Instead of analyzing ten indicators at once, you focus on what the market is doing right now.
Key benefits include:
- Cleaner charts
- Faster decision-making
- Better understanding of market psychology
- Flexibility across Forex, Crypto, Futures, ETFs, and stocks
- Easy integration with Risk Management principles
Many traders also combine price action with Fundamental Analysis, but price remains the final decision-maker. However, before using any setup, it is important to understand the overall market structure.
Also Read: Market Order & Limit Order
Price Action Trading Starts With Market Structure
Uptrend
Also Read: Options Trading
Downtrend
Also Read: Pledge
Range
Understanding structure first can prevent many costly Trading Mistakes.
Also Read: Golden Crossover
Use Multiple Timeframes for Better Trade Timing
Many traders analyze more than one timeframe before entering a trade.
A simple approach is:
This process helps you see the bigger picture while improving entry timing. It can also reduce the chances of trading against the dominant trend. This approach is often called Multi Timeframe Analysis and is widely used by price action traders to align short-term entries with the broader market trend.
Also Read: Gold & Silver Trading
Key Price Levels
Price action traders rely heavily on support and resistance levels.
Support:
A zone where buying interest repeatedly appears.
Resistance:
A zone where selling pressure repeatedly appears.
Rather than drawing dozens of lines, focus only on obvious levels that stand out on the chart.
These important areas are often referred to as Key Levels because many traders monitor them for potential reactions. Demand and supply zones can reveal areas of strong market interest.
A simple rule:
The clearer a level looks, the more likely traders are to watch it.
Also Read: Crude Oil Trading
Price Action Trading and Candlestick Analysis
Candles tell a story. Every candle provides insight into market participation.
When studying Candlestick Trading, pay attention to:
Some commonly used patterns include:
- Bullish engulfing
- Bearish engulfing
- Pin bars
- Morning and Evening Star
- Inside bars
However, patterns work best near support, resistance, or major structure levels.
This is where Candlestick Psychology becomes useful. It helps you understand why a pattern forms instead of simply memorizing shapes.
Also Read: Natural Gas Trading
Four Practical Price Action Trading Setups
1. Breakout Trading
Also Read: Sector Rotation
2. Pullback Trading
Also Read: Nifty Expiry
3. Double Bottom and Double Top
These classic reversal patterns can signal exhaustion. A Double Bottom may suggest buyers are stepping in. A Double Top may indicate sellers are gaining strength. Confirmation matters more than the pattern itself.
Many traders use these patterns to identify potential Trend Reversal opportunities, especially near major support or resistance levels.
Also Read: How to Use TradingView
4. Triangle Chart Pattern
A Triangle Chart Pattern shows consolidation. As price compresses, momentum often builds. Eventually, price breaks out in one direction.
Example: A Simple Pullback Trade
Imagine EUR/USD is making higher highs and higher lows.
Price then pulls back toward a support zone and forms a bullish engulfing candle.
You enter after the bullish engulfing candle closes above support, place your stop loss below support, and target the next resistance level.
If the trade offers a 1:2 Risk to Reward Ratio, a $100 risk could target a $200 profit.
This simple process combines market structure, support, candlestick confirmation, and risk management in a single trade idea.
Also Read: Moving Averages
Quick Tip: Watch for False Breakouts
Some breakouts reverse before establishing a trend.
Sometimes price briefly moves beyond support or resistance, triggers stop losses, and then reverses sharply. This behavior is often called a liquidity grab or stop hunt.
Waiting for a candle close or a retest can help filter out some false breakouts.
Also Read: Order Block Trading
Using Confluence for Better Decisions
One signal alone is rarely enough. Strong setups often contain multiple factors working together. This is called Confluence.
For example:
- Support level
- Bullish candlestick pattern
- Trendline support
- Volume confirmation
- Price rejection at key levels
When several factors align, the setup becomes more compelling.
Some traders also combine price action with:
- RSI
- Bollinger Band
- Volume Analysis
- Market Depth
- Fibonacci Retracement
The goal is not to create complexity. The goal is to improve confidence.
Also Read: Copper Trading
Price Action Trading and Risk Management
Even the best setup can fail. That is why Risk Management matters more than prediction.
A simple approach includes:
- Protect capital by risking a small percentage
- Using stop losses
- Seek setups with higher reward than risk
- Following clear Trading Rules
For example:
If you risk $100 and target $200, you have a 1:2 Risk to Reward Ratio. You do not need to win every trade. You simply need consistency.
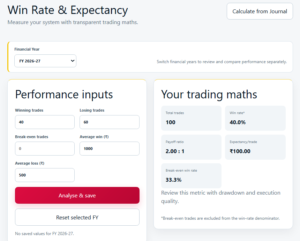
Many successful traders focus on protecting capital first and generating profits second. You do not need a very high win rate to become profitable.
For example, a trader using a 1:3 Risk to Reward Ratio may remain profitable even with a win rate below 50%.
This is why many experienced traders focus more on risk control than on trying to win every trade.
Also Read: Gift Nifty
Simple Position Sizing Formula
Many traders calculate position size before entering a trade.
Position Size = Account Risk ÷ (Stop Loss Distance × Value Per Point)
Example: If you risk $100, your stop loss is 50 points, and each point equals $1, your position size would be 2 units.
This approach helps keep risk consistent from trade to trade.
Also Read: Circuit Limit
Always Check Major Market News
Even strong price action setups can fail during major economic events.
Examples include:
- Interest rate decisions
- Inflation reports
- Employment data
- Central bank announcements
Many traders check the economic calendar before entering a trade. A few minutes of preparation can help avoid unnecessary volatility.
Also Read: Aluminium Trading
The Role of Trading Psychology
A good strategy can still fail if emotions take over.
Common challenges include:
- Trading Fear
- Revenge Trading
- FOMO
- Overtrading
- Lack of patience
This is why Trading Psychology plays a major role in long-term performance.
A Trading Journal can help you identify emotional mistakes and improve your decision-making.
Over time, you may notice patterns such as:
- Entering too early
- Exiting winners too quickly
- Ignoring your plan
Awareness often leads to improvement.
Also Read: Gold vs Silver
Backtesting and Forward Testing
Also Read: Hedging
Backtesting
It examines past market data to evaluate a trading setup.
Also Read: NiftyBees
Forward Testing
Forward Testing involves applying the strategy in current market conditions, usually through Paper Trading or a demo account.
Combined, these testing methods strengthen trading confidence.
Also Read: Why Silver is in Demand
Common Price Action Trading Mistakes
Repeated mistakes often hold traders back
Avoid these common mistakes:
- Trading every candle
- Ignoring market structure
- Chasing momentum
- Moving stop losses
- Using poor Risk Management
- Ignoring major news events
- Constantly changing strategies
Success often comes from Trading Consistency, not constant experimentation.
Also Read: EGR
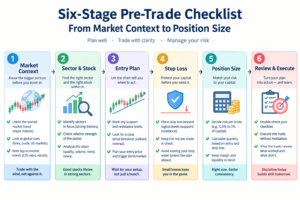
A Simple Price Action Trading Checklist
Before entering a trade, ask yourself:
- Is the trend clear?
- Am I near support or resistance?
- Do I see a valid setup?
- Is my risk defined?
- Does the trade fit my plan?
- Is the reward worth the risk?
- Have I considered major news events?
If several answers are “no,” waiting may be the better decision. Remember, patience in trading is a skill.
Also Read: Gold Trading
Frequently Asked Questions
Is Price Action Trading good for beginners?
Yes. It teaches market structure, momentum, and risk management without relying heavily on indicators.
Can Price Action Trading work in Forex and Crypto?
Yes. Traders use it in Forex, Crypto, stocks, Commodity Trading, and Futures and Options markets.
Can Price Action Trading Be Used Without Indicators?
Yes. Many traders use pure price action by focusing on market structure, support and resistance, and candlestick behavior. Others choose to add indicators for additional confirmation.
Which timeframe is best for Price Action Trading?
Do I need indicators for Price Action Trading?
No. However, some traders use tools such as RSI, Bollinger Band, or Fibonacci Retracement for additional confirmation.
How much should I risk per trade?
Many traders risk 1% or less of their account on a single trade, although individual risk tolerance varies.
Also Read: Trading Taxes
Final Thoughts
Traders use price action instead of forecasting outcomes. It focuses on interpreting current market behavior.
Trading becomes more logical when you understand market behavior and risk.
Start simple. Focus on one or two setups. Build a simple Trading Plan and keep a Trading Journal. Practice through Backtesting and Forward Testing. Most importantly, stay consistent.
The traders who succeed are rarely the ones searching for a secret indicator. More often, they are the traders who follow a solid process and make disciplined decisions trade after trade.
Also Read: MCX