Volume is simple to understand, yet frequently ignored by market participants. Price shows where the market is headed. Trading activity reflects the level of market participation. Reading price and participation together helps identify stronger, higher-quality setups.
Several factors can increase market activity, including. It provides insight into trend quality and highlights stronger trading opportunities.
Table of Contents
What is Volume in Trading?
It captures the overall level of market activity over a defined interval. Every candle on your chart has a matching volume bar. Larger bars usually reflect increased activity, while smaller bars suggest lower involvement.
Think of volume as the crowd behind a football match. A loud, packed stadium shows strong excitement. A nearly empty stadium tells a different story. Markets behave in a similar way.
High trading activity often means:
- Greater trading participation across the market.
- Liquidity is usually better.
- Higher participation often gives greater strength to market moves.
Low trading activity often means:
- Fewer participants.
- Slower price movement.
- Increases the risk of misleading signals.
Also Read: Pledge
Also Read: Circuit Limit
How is Volume Actually Counted?
Each executed transaction increases the total by the number of shares, contracts, or units exchanged. A single exchange of 500 shares contributes 500 to the total activity. A widespread myth is that buyers and sellers each add to the total independently. They are not. Large institutional orders may also be split into several smaller executions, which is why one order can appear as multiple trades on the exchange.
Also Read: How to Use Stock Heatmaps
Why Volume Plays a Key Role
Price can move for many reasons. However, market participation helps you judge whether that move deserves your attention.
Imagine a stock breaks above resistance. A move becomes more convincing when participation exceeds its recent average. That increases the chance of continuation. On the other hand, a breakout with weak participation often loses momentum quickly.
This simple check can help you filter out many potential False Breakouts, especially when combined with Price Action Trading and a well-drawn Trendline.
Also Read: NiftyBees
Market Participation
Large institutions often leave footprints because their buying or selling activity can increase overall trading activity. Large institutions often break sizable orders into smaller executions to reduce market impact, yet their activity can still create noticeable increases in overall trading activity.
That doesn’t mean every activity spike signals Smart Money Concept activity. News events, Earnings updates, and market openings can also create unusual trading activity. Before acting, compare today’s activity with its 20–50 session average.
Sharp activity increases carry more weight when backed by recognizable chart patterns.
Also Read: How to Shield Your Trading Account
Why Activity Suddenly Spikes
Market participation often increases because of:
- Company earnings
- Major economic updates
- Index rebalancing
- Institutional buying or selling
- Short covering
- Option expiry
- Market opening
- Market closing
A notable increase in activity does not necessarily support a prolonged move. Evaluate the market’s behavior around the surge before placing a trade.
Also Read: Fundamental Analysis
Applying Volume to Make Better Trading Decision
It works best alongside price rather than as a standalone signal.
Also Read: Gift Nifty
1. Confirm Trends
Healthy trends usually attract consistent participation.
For example:
- Higher prices backed by active participation suggest stronger upward momentum.
- Price declines + increased participation = stronger selling interest.
- Rising price + falling participation = weakening buying interest.
- Falling prices with weaker participation may indicate sellers are losing strength.
No rule works every time. Still, these relationships give valuable context before entering a trade.
Also Read: Overtrading
2. Spot Strong Breakouts
Many traders chase every breakout. That often leads to frustration.
Before entering, ask yourself:
- Is trading activity above average?
- Did price close convincingly beyond the resistance or support level?
- Is the move supported by the overall market?
A breakout is generally more reliable when all three conditions align.
This approach also works well alongside Candlestick Trading, Market Depth, and higher Timeframe analysis.
Also Read: Commodity Trading
3. Combine Candlesticks with Confirmation
Active market participation can reinforce candlestick-based trade signals.
For example:
- A bullish pin-bar pattern + increased buying interest often points to a potential reversal after a decline.
- An engulfing bullish candle supported by increased participation often confirms a reversal setup.
- When a Doji appears with unusually high trading activity, it may suggest growing market uncertainty.
- Marubozu + strong participation usually reflects strong conviction from buyers or sellers.
Always read candlesticks together with the surrounding market structure.
Also Read: Smart Money Concept
4. Identify Weak Pullbacks
Also Read: How to Open a Demat Account
Also Read: Demand & Supply
Recognize Different Volume Phases
It changes as a trend develops.
- Healthy trend: Price rises steadily while participation remains strong.
- Mature trend: The market continues higher, while trading activity steadily declines.
- Climax volume: A significant activity surge following a lengthy trend often reflects emotional decisions.
- Distribution: Often develops when institutional traders sell into rising prices as upward momentum weakens.
- Accumulation: Often occurs after a prolonged decline when larger market participants gradually build positions before a potential new uptrend.
Reading these phases helps you judge whether a trend is strengthening or losing momentum.
Also Read: Backtesting Mastery
Average vs Relative Activity
Basic trading statistics show only part of the market story.
A stock trading one million shares daily may show 1.2 million shares today. That is only a small increase.
One stock might average 100,000 shares but suddenly record 500,000. Although the number is smaller, the second stock shows much stronger relative activity.
Traders often use Relative Volume (RVOL) to measure today’s participation against normal levels. An unusually high RVOL often reflects growing interest driven by recent catalysts.
Early-session trading activity often provides stronger confirmation than quiet late-session moves.
Average Daily Volume (ADV) shows the typical number of shares or contracts traded over a chosen period. If today’s trading activity is much higher than the ADV, the move deserves closer attention. As an example, an RVOL above 2 often signals exceptional market participation.
Also Read: Forward Testing
Tick Data vs Real Trading Activity
Stock exchanges report actual trading volume because every transaction is recorded. Forex works differently because there is no single central exchange. In forex, most platforms rely on tick volume, which tracks price changes rather than actual trades. Although tick volume is not identical to exchange volume, many traders still rely on it because studies and practical experience suggest it often correlates reasonably well with overall market activity. Always remember that stock volume is generally more precise than forex tick volume. In exchange-traded markets like stocks and futures, traders use actual exchange data. For decentralized markets like forex, tick volume is often used as a practical substitute.
Also Read: Gold & Silver Trading
Popular Indicators for Reading Volume
Raw market activity already tells a useful story. Still, a few indicators can make that story easier to read. The key is to keep things simple instead of filling your chart with too many tools.
Here are some popular choices:
- OBV (On-Balance Volume): Shows whether market participation strengthens the existing trend.
- VWAP (Volume Weighted Average Price): Widely used in Intraday Trading to judge whether price is trading above or below its average value.
- Money Flow Index (MFI): Combines price and trading activity to measure buying and selling pressure.
- Volume Profile: Shows the value areas where the greatest trading activity occurred.
Use these indicators to support your analysis rather than lead it.
| Indicator | Best For | Limitation |
|---|---|---|
| OBV (On-Balance Volume) | Confirming trend direction | Less reliable during sideways markets |
| VWAP (Volume-Weighted Average Price) | Intraday Trading | Limited value for swing trading |
| MFI (Money Flow Index) | Measuring momentum | May produce false signals |
| Volume Profile | Identifying support and resistance zones | Requires practice to interpret accurately |
Volume Profile stands out because it identifies where trading was concentrated instead of simply measuring overall market activity. Traders often watch the Point of Control (POC), High Volume Nodes (HVN), and Low Volume Nodes (LVN) to identify price areas where the market previously accepted or rejected value, helping traders recognize areas where trends may slow, reverse, or move rapidly through thinly traded zones.
Also Read: Crude Oil Trading
Also Read: Natural Gas Trading
Volume Reflects Trading Psychology
Every trade happens because someone decides to buy while someone else decides to sell. As a result, market activity often reveals trader sentiment.
Positive developments accompanied by higher activity often point to stronger buying interest. Conversely, fearful selling often reflects emotion instead of logical thinking.
Many experienced traders use it alongside Trading Psychology for added confirmation. Understanding crowd behavior helps you avoid emotional decisions and follow your trading plan with more confidence.
Rising trading activity often reflects changing emotions. Greed and FOMO can drive buyers to chase prices higher, while panic selling creates sharp increases in bearish volume. During recoveries, profit booking and short covering also influence trading activity. Learning to recognize these emotional shifts helps you avoid following the crowd at the wrong time.
Also Read: Copper Trading
Common Mistakes to Avoid
Many beginners misuse it because they expect it to predict every move. It doesn’t.
- Treating every high-activity candle as bullish.
- Ignoring the overall trend.
- Trading only because volume increased.
- Forgetting to compare today’s trading activity with the recent average.
- Ignoring major news events.
- Using volume without support, resistance, or chart structure.
Remember, market activity provides context. It does not give guarantees.
Also Read: Bollinger Band
Build a Better Trading Routine
Include it in your pre-trade routine instead of reviewing it after entry.
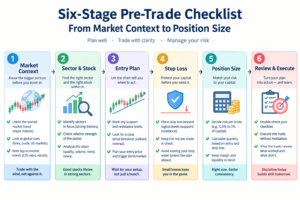
A simple checklist can help:
- Has today’s activity risen above normal levels?
- Is price respecting support or resistance?
- Is market activity confirming the prevailing trend?
- Does this position match your capital preservation strategy?
- Is the potential downside acceptable under your trading plan?
- Have you saved similar setups in your Trading Journal or checked how they performed in the past?
Following the same routine improves consistency over time. It also reduces emotional trading.
A practical workflow looks like this:
- Find stocks trading with volume above their 20-day average or an RVOL above.
- Wait for a clean Breakout, Double Bottom, or Triangle Chart Pattern.
- Check whether it increases during the breakout.
- Confirm the setup on a higher Timeframe. Example: First, review the daily chart for elevated trading activity around the breakout level. Then verify the trend on the hourly chart and fine-tune your entry using the 5-minute chart.
- Enter only after defining your stop loss and Risk to Reward Ratio.
This simple routine combines volume with structure instead of relying on it alone. Even the strongest confirmation signal can fail, so always define your stop loss and position size before entering a trade.
Before risking real capital, review similar setups through backtesting and record the results in your trading journal.
Also Read: Aluminium Trading
How It Works Across Different Markets
It is useful in almost every financial market, although the data source may differ.
- Stocks: Exchange volume shows actual shares traded.
- Futures and Options: Volume helps confirm participation and liquidity across index, currency, and commodity contracts.
- Crypto: It varies between exchanges, so compare reliable platforms.
- ETFs: It helps measure trading interest and liquidity.
No matter what you trade, it becomes more valuable when combined with Price Action Trading, Risk to Reward Ratio, and a clear trading plan.
Also Read: BTST Strategy
When It Can Mislead You
It is powerful, but it is not perfect. Be extra careful during:
- Pump-and-dump stocks
- Very low-liquidity shares
- Fake crypto volume
- News-driven volatility
- Expiry-day spikes
Similarly, experienced traders also watch for activity dry-ups. When it gradually falls during a pullback, it often shows that selling pressure is weakening. If buyers return with stronger buying activity, the existing trend may continue.
If you trade Futures and Options, combine it with Open Interest. Rising trading activity alongside increasing Open Interest often suggests new positions are being created. Falling Open Interest usually indicates existing positions are being closed rather than new ones being opened.
Options traders should also watch call volume, put volume, and unusual trading activity. A sudden jump in option volume together with rising Open Interest often signals fresh market participation, while the Put-Call Ratio (PCR) can provide additional insight into overall market sentiment.
Also Read: Gold vs Silver Trading
Also Read: Why Silver is in Demand
Quick Decision Guide
| Situation | What to Look For |
|---|---|
| Breakout | Trading activity above the recent average |
| Pullback | Lower trading activity than the overall trend |
| Trend Continuation | Rising prices supported by steady market participation |
| Potential Reversal | A climactic activity surge after a prolonged trend |
| Weak Move | Price movement without support from market participation |
Also Read: EGR
Frequently Asked Questions
Does High Activity Always Mean the Price Will Continue?
No. High trading activity shows strong participation, but price can still reverse. Always confirm the move with market structure and trend.
What is RVOL?
RVOL (Relative Volume) indicates whether today’s activity is above or below its recent average. It helps you spot unusual market interest.
Which Volume Indicator is Best for Beginners?
OBV and VWAP are good starting points because they are easy to understand and widely used by traders.
Can it Help Identify False Breakouts?
Yes. A breakout with low or declining volume often has a greater chance of failing than one supported by strong participation.
Should I Use Volume in Every Trading Strategy?
Yes. Whether you prefer swing trading, Intraday Trading, or Positional Trading, market participation provides valuable confirmation for your analysis.
Which Timeframe Gives the Most Reliable Volume Signals?
Higher timeframes such as the daily and weekly charts usually provide more reliable volume information because they include more market participation. Lower timeframes can still be useful, especially for Intraday Trading, but they often contain more short-term noise.
Also Read: Trading Taxes
Final Thoughts
Volume is much more than a series of bars below your chart. It reveals how actively traders support a price move. When you combine it with chart structure, trend analysis, and disciplined Risk Management, your decisions become more informed.
Don’t try to predict every market move. Instead, use overall market activity to focus on higher-quality trading opportunities. Over time, that simple habit can improve your confidence, sharpen your decision-making, and bring greater consistency to your trading results.
Seasoned traders typically use multiple forms of confirmation. Instead, they combine volume analysis with price structure, risk management, and disciplined execution. No strategy wins every time, but following these principles consistently can strengthen decision-making.
Also Read: MCX